1
$\begingroup$

If the p-value suggests significance, can the test statistic give any more information? I.e., can you use the test statistic to tell if some of the significance is more significant than other parts?

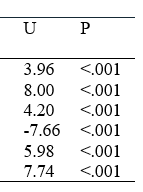
I ran Mann-Whitney U tests and these U's are, overall, far higher than any other U's in my analysis, even for other tests that resulted in p<.001. Is it valid to say that the test which resulted in the 8.00 or -7.66, for instance, were more significant than others, given that no other U statistic of the 48 tests I ran even exceeded 5.00?

partial chart of U? scores and p values

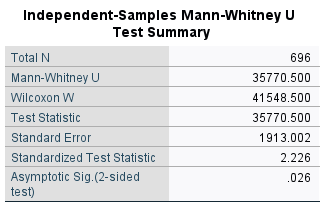
Edit: In response to Glen_b's comment, I relooked at my output and sure enough Mann-Whitney U is a separate value from the (standardized) test statistic.

SPSS output for Mann-Whitney U test

I suppose, then, my question hasn't changed, because I'm still asking about the test statistic, just properly labelled now. What am I supposed to call those values in my write-up?

$\endgroup$
9
  • $\begingroup$ The standard definition of the U-statistic would depend on sample sizes, and U-values for different sample sizes are then not comparable, although some software may standardise them in order to make them comparable. This should be documented in the help system, but unfortunately is sometimes not. Other than that, I'd be careful because any observed difference between "more and less significant" may itself be due to random variation, i.e., not significant. $\endgroup$ Commented Nov 6, 2022 at 22:01
  • 1
    $\begingroup$ Those values in the first column are not U-values (which will be integers). They might be z scores, $\frac{U-E_0(U)}{\sigma_0(U)}$ $\endgroup$
    – Glen_b
    Commented Nov 6, 2022 at 22:38
  • $\begingroup$ @ChristianHennig I'm sure it's somewhere in SPSS's documentation. Good point about sample size being relevant. I'm very new to statistics and forget the basics sometimes. $\endgroup$ Commented Nov 9, 2022 at 1:36
  • 2
    $\begingroup$ You might have some misconceptions/confusions there. . . . 1. No, you don't have to have non-normal data to use a Mann-Whitney; if you had a normal population (but which of course you have no way to know to be the case) - along with the other usual assumptions - the Mann Whitney has all its usual properties and has excellent power (A.R.E. 0.955) vs the t test against a location shift alternative (while some other nonparametric tests can be fully efficient, at least in large samples). $\,$ 2. You can certainly compute z-scores whether or not you have normality. $\,$ ... $\endgroup$
    – Glen_b
    Commented Nov 9, 2022 at 1:51
  • 2
    $\begingroup$ 3. In any case, we're talking about computing a Z-score on $U$, not on the data; $U$ is a function of the ranks; under $H_0$ the distribution of the data is irrelevant to the rank distribution, as long as you have exchangeability. $\,$ 4. In large samples $\frac{U-E_0(U)}{\sigma_0(U)}$ is asymptotically standard normal under $H_0$. . $\endgroup$
    – Glen_b
    Commented Nov 9, 2022 at 1:51

1 Answer 1

4
$\begingroup$

It probably won't be helpful for most readers to report the W or U statistics.

The "standardized test statistic" appears to be the z value, or z statistic. This is helpful to report, as most readers will be familiar with it, and will have some sense of what the values mean.

In a sense, the value of the z statistic could be interpreted as "more significant" or "less significant". Though, if you are reporting p-values to as low as < 0.001, making any argument for differences in p-values lower than this probably doesn't carry a lot of meaning. Simply reporting the z-values and the p-values probably conveys the information you want to convey.

Reporting effect sizes will probably be meaningful for your purpose. For Wilcoxon-Mann-Whitney test, a relevant effect size statistic expresses the probability of an observation in one group being larger than an observation in the other group. There are a few statistics that express this, including: Vargha and Delaney’s A, Glass rank biserial correlation coefficient, Cliff’s delta, Grissom and Kim's Probability of Superiority.

You can also report other meaningful comparisons, like the differences in medians.

As to practical significance --- I like to use the term practical importance to avoid confusion --- this is really a judgement based on your field and specific circumstances, and can include things like economic considerations. It might be partially based on the p-value or the effect size.

$\endgroup$
1
  • 2
    $\begingroup$ I really appreciate the term 'practical importance' as a distinct term. I think I've used the word 'actionable' as well, to indicate whether you can actually make any decisions based on the differences. $\endgroup$ Commented Nov 28, 2022 at 15:10

Your Answer

By clicking “Post Your Answer”, you agree to our terms of service and acknowledge you have read our privacy policy.

Not the answer you're looking for? Browse other questions tagged or ask your own question.