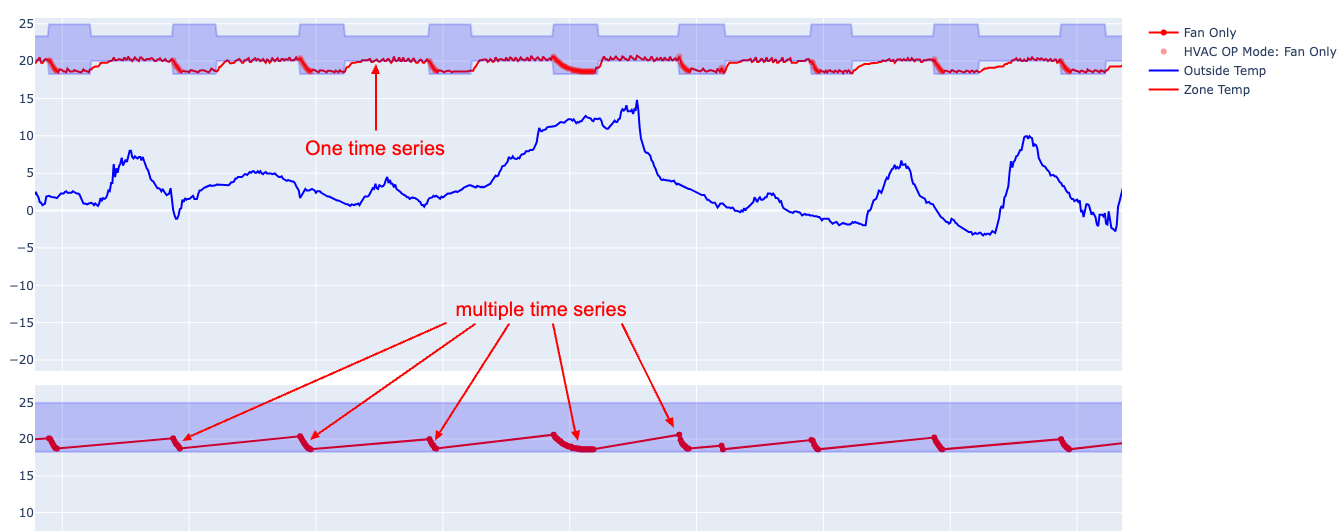
I have some time series data that shows a building indoor temperature subject to outside temperature. When the heating/cooling is turned off, the building slowly cools down (or heats up) towards the outside temperature. Now i was able to filter these periods in the time series. The data looks like the one in the picture. What would it be the best approach to fit a model to this data? collect different time series of the exponential decay (cooling down) and fit as many models into these time series, proceeding then to somehow aggregate the results into a model that can predict based on an initial temperature how long it'd take to get to x degrees for example or to keep it as one and fit a model? please advise. Thanks in advance!
Edit: I want to find out how long it takes for the building to cool down in this case, provided the AC is providing no heating. The temperature should converge to the outside temperature and it does so in an exponential way. different outside temperatures will dictate the rate of the exponential curve that best models the data and I'm wondering how to best tackle this in practice.

-
$\begingroup$ Could you expand on the precise goal of such a model? "...predict based on an initial temperature how long it'd take to get to x degrees for example" is a good start but a lot more detail would help. $\endgroup$– mktCommented Jun 2, 2023 at 14:47
-
$\begingroup$ sure, I want to find out how long it takes for the building to cool down in this case, provided the AC is providing no heating. The temperature should converge to the outside temperature and it does so in an exponential way. different outside temperatures will dictate the rate of the exponential curve that best models the data and I'm wondering how to best tackle this in practice $\endgroup$– MDSvCommented Jun 2, 2023 at 14:53
-
2$\begingroup$ This is classic heat transfer. There is a thermal resistance stack to the outside, heat flows in based on lumped capacitance and temperature difference, and when the AC is on the heat is moved out. Split by AC on vs. AC off, and if you have fan-only, then split AC by Fan (so 4 factors), look at temperature difference to outside, and fit the curve by a polynomial-power-law (think decaying charge on a capacitor). Do you have a csv of a sample of the data? $\endgroup$– EngrStudentCommented Jun 2, 2023 at 15:53
-
$\begingroup$ I agree, the problem itself is well known. Mind you however I'm trying to solve this in a completely data driven manner, so I only have temperatures to work with for now. That what you suggest I have done, that is the bottom plot where the AC is off. What I'm looking to do now is what is best to do: fit n different models (one for each of the decaying events) or fit just one model? I can try both of course but am unsure what would be best. Thank you for your reply. Unfortunately I cannot share the original data :/ $\endgroup$– MDSvCommented Jun 2, 2023 at 16:48
-
$\begingroup$ Please edit that into the question, comments are likely to be ignored. $\endgroup$– mktCommented Jun 2, 2023 at 18:01
1 Answer
What you seem to be willing to settle for is an estimate of the thermal time constant for the building. That's the simplest lumped-element model for a thermal system. You assume that the thermal mass within the building is well-mixed in terms of temperature with the only resistance to heat flow at the exterior wall, which might be a risky assumption. You at least have the advantage that the temperature changes are relatively small in magnitude (about 2 degrees C), allowing for a simplified model where a first-order approximation like this might work well enough for your purposes.
The results will probably depend on whether ventilation fans are at work in the building even if the heating or air conditioning is off. The legend to your plot suggests that might sometimes be the case. If so, you need to take that into account.
If there is resistance to heat flow within the building (e.g., walls, closed doors, etc.) and there are masses within the building that lose heat slowly (e.g., thick solid walls), then what you will get at best is a model of temperature changes at the location of your temperature sensor, not necessarily representing the building as a whole. Furthermore, my sense is that the simple exponential model based on Newton's law of cooling might not work well, even for that single measurement location, when thermal transfer within the building is slow.
From that perspective, it would make sense to analyze individual time courses separately, restricted to times when heating/cooling systems are off. When you do that, however, you should keep critical information associated with each estimate of the time constant: actual initial building temperature, actual outside temperature, interior fan status, anything else that might affect heat flow. Then you can evaluate whether the "time constant" you are estimating is truly constant, versus systematically changing with interior and exterior temperatures and the status of ventilation fans.
-
$\begingroup$ I find this very helpful. I hope not just because of confirmation bias as this was the way I was inclined. In any case, thank you so much! $\endgroup$– MDSvCommented Jun 2, 2023 at 21:45
