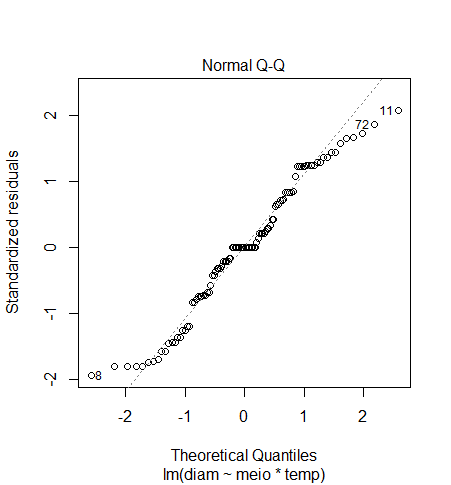
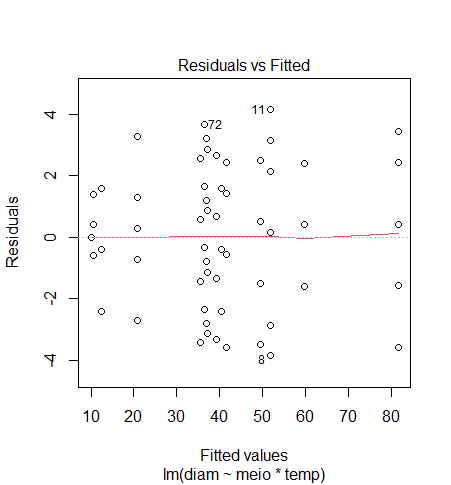
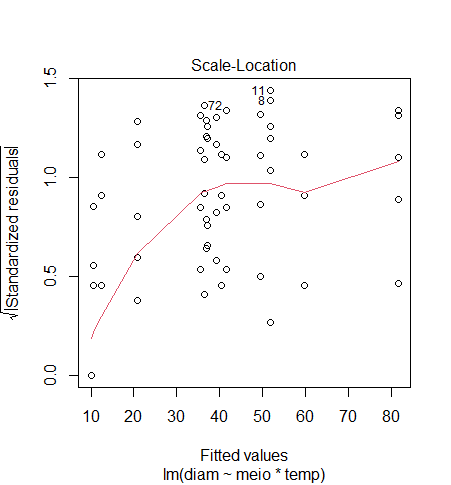
A couple of pages on this site have useful discussions of how to evaluate the diagnostic plots. This page discusses all 4 of the default R diagnostic plots for lm models, and this page goes into more detail about the normal Q-Q plot.
The residuals versus fitted plot and the scale-location plot both indicate some heteroscedasticity, in that the residuals tend to be somewhat smaller around lower predicted values than around higher predicted values. The apparent "outliers" on the Q-Q plot indicate a possible "light-tailed" distribution of residuals, with not as many extreme values as might have been expected. Also, it's hard to interpret a Normal Q-Q plot if there isn't homoscedasticity to start with. As Kjetil Halvorsen said in a comment, you certainly don't want to omit those "outliers." Outlier removal should only be done if there's a very good reason, like evidence of a technical measurement error. Those "outliers" on the Q-Q plot certainly shouldn't be omitted arbitrarily.
The Kruskal-Wallis test is only for one-way ANOVA, while you have a two-way design (4 media by 4 temperatures). So that won't work here. Also, non-parametric models make it harder to do comparisons among different specific treatment combinations, or to make predictions.
It's not clear that the violations of homoscedasticity and normally distributed errors are bad enough to matter much in practice here. In particular, if your main interest is to identify the growth conditions that maximize diam, then whatever combination is leading to predicted values of >80 is a clear winner, more than 20 units greater than the next-best combination while only having maximum absolute residuals of about 4 units. Tweaks to the model aren't likely to affect that interpretation at all.
If you are nevertheless worried about the apparent violation of homoscedasticity, you might consider a simple transformation of the outcome values, like square-root or log (a special case of Box-Cox), and perform ANOVA on the transformed data. That often can help with such situations where the error magnitudes increase with the fitted values. The downside is that you are then modeling the means of the square-roots or logs of the data values rather than the mean values themselves.
An alternative would be to use a regression method that takes heteroscedasticity into account; see this page and its links for approaches. For example, the answer from gung - Reinstate Monica recommends weighted least squares, possibly combined with robust standard errors. Depending on the specific approach, the differences from your model will be primarily or even solely in terms of standard errors, not the point estimates of treatment effects.
You also could consider an ordinal logistic regression model, as explained for example in Chapters 13 and 14 of Frank Harrell's Regression Modeling Strategies. It can be thought of as a way to generalize the Kruskal-Wallis and similar non-parametric tests to more complex designs, in a way that is better suited for specific treatment comparisons and for predictions. It works with any ordered outcomes (even if there are as many outcome levels as observations) and makes no assumptions about error distributions.
If the fundamental results of a transformed, weighted, or robust model isn't substantially different from the simple linear model, then you might simplify the presentation by showing the simple linear model (as you do for the other strains) while stating that, given potential violation of linear model assumptions, you evaluated another approach without finding substantial differences in interpretation. You might provide the results of the transformed, weighted, or robust model in supplemental data to support that claim.


