I am trying to see which predictors in my dataset are interacting with each other to see if their inclusion can improve model prediction. I followed these steps to do my analysis:
- First I used
lmon all predictors. - Then I used backward regression to select predictors.
- Then I ran
lmon the selected predictors. - Then I ran
lmon the selected predictors + interacting predictors.
Here is the code:
##do full mode summary rsquared:
summary(lm(ENSG00000130943.6 ~ ., data = combine_df))$r.squared
[1] 0.9439404

##backward regression:
fullModel = lm(ENSG00000130943.6 ~ ., data = combine_df) # model with all 9 variables
nullModel = lm(ENSG00000130943.6 ~ 1, data = combine_df) # model with the intercept only
backward.model <- stepAIC(fullModel, # start with a model containing all the variables
                direction = 'backward', # run backward selection
                scope = list(upper = fullModel, # the maximum to consider is a model with all variables
                             lower = nullModel), # the minimum to consider is a model with no variables
                trace = 0) # do not show the step-by-step process of model selection


summary(backward.model)$r.squared
[1] 0.9377306

##now in backward model try to do with interaction term:
summary(lm(formula = ENSG00000130943.6 ~ rs1 + rs3 + rs4 + rs6 + rs7 +
       rs8 + rs9 + rs10 + rs11 + rs12 + rs14 + rs18 + rs20 + rs25 +
        rs26 + rs27 + rs40 + rs44 + rs45 + rs46 + rs47 + rs48 + rs49 +
       rs50 + rs53 + rs54 + rs57 + rs58 + rs59 + rs60 + rs63 + rs64 +
       rs65 + rs68 + rs69 + rs70 + rs71 + rs72 + rs76 + rs78 + rs80 +
       rs81 + rs82 + rs83 + rs85 + rs88 + rs89 + rs93 + rs98 + rs102 +
      rs105 + rs107 + rs109 + rs110 + rs111 + rs112 + rs117 + rs118 +
        rs121 + rs122 + rs123 + rs124 + rs125 + rs126 + rs127 + rs128+rs128*rs123,
   data = combine_df))$r.squared
[1] 0.9388159
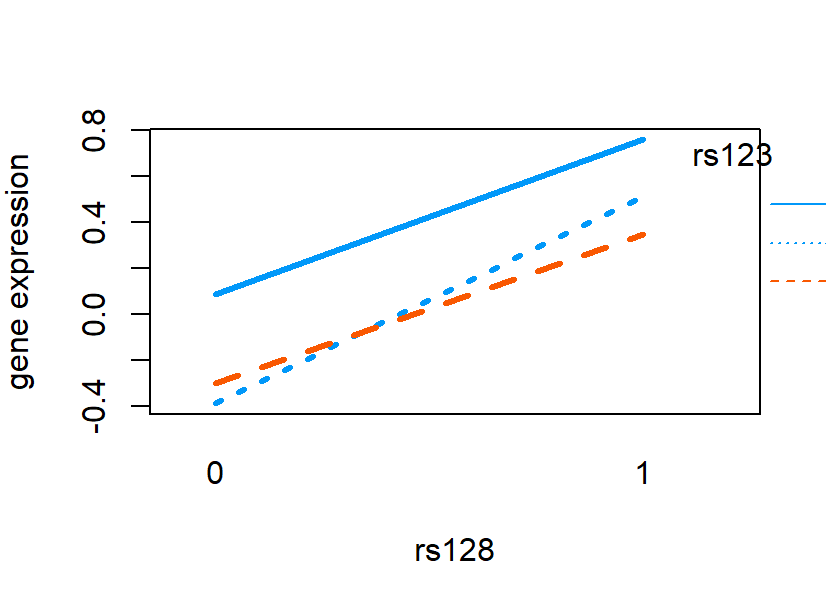
I then did an ANOVA test on predictors that might interact and plotted their interactions. The ANOVA test gives a p-value of 0.89 for interacting predictors, which is not good. Then I plotted an interaction plot which does show an interaction.

summary(anova)
             Df Sum Sq Mean Sq F value  Pr(>F)
rs128         1   3.59   3.591   9.993 0.00181 **
rs123         1   3.85   3.852  10.719 0.00125 **
rs128:rs123   1   0.01   0.006   0.017 0.89631
Residuals   201  72.24   0.359
---
Signif. codes:  0 ‘***’ 0.001 ‘**’ 0.01 ‘*’ 0.05 ‘.’ 0.1 ‘ ’ 1
>
> anova
Call:
   aov(formula = ENSG00000130943.6 ~ rs128 * rs123, data = combine_df)

Terms:
                   rs128    rs123 rs128:rs123 Residuals
Sum of Squares   3.59130  3.85217     0.00612  72.23577
Deg. of Freedom        1        1           1       201
I wanted to ask whether this analysis is correct in terms of including interacting terms as well as how to see all the interacting terms when number of predictors are large. I selected rs128 and rs123 as interacting since it shows *** during backward regression for these two variables. I basically want to further rank or select predictors whose presence can improve model performance. I will be highly grateful if someone can provide more guidance on this since I am new to regression analysis. My dataset for reference:
dput(combine_df[1:5,1:5])
structure(list(ENSG00000130943.6 = c(-0.0814098051060948, 0.206379671030366,
0.321031350919992, 0.513621983895094, 0.659905091586951), rs1 = c(2L,
0L, 1L, 0L, 0L), rs2 = c(2L, 0L, 1L, 0L, 0L), rs3 = c(2L, 0L,
1L, 1L, 1L), rs4 = c(0L, 0L, 0L, 0L, 0L)), row.names = c("GTEX-1117F",
"GTEX-111FC", "GTEX-1128S", "GTEX-117XS", "GTEX-1192X"), class = "data.frame")
