2
$\begingroup$

There are some previous post treating how to validate a logistic regression: Source 1 and Source 2.

But, still, those threads does not answer my question.

Therefore:

If a logistic regression predict probabilities. How can one validate a logistic regression?

Googling I found two ways of validate a model:

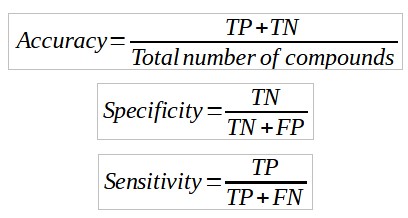
  1. The first one is by evaluating the confusion matrix Source3 (Accuracy, specificity and sensitivity) enter image description here

  2. The second one is by evaluating r, r$^2$ and MAE in different ways such as: (1) Validation Set Approach, (2) Leave one out cross-validation(LOOCV), (3) K-fold cross-Validation, and (4) Repeated K-fold cross-validation. Source 4

Therefore, What is the correct way to validate a logistic regression? By applying option 1 or 2?

$\endgroup$
5
  • $\begingroup$ What are you going to be using the logistic regression for? $\endgroup$ Commented Jun 30, 2023 at 16:46
  • $\begingroup$ @DemetriPananos Thank you for your comment, I am going to use it to predict the mutagenicity of a molecule data set, which values are 1 if mutagenic and 0 if non mutagenic. Of course, when I obtain the logistic regression I obtain the output in decimal values and those are between [0,1]. $\endgroup$ Commented Jun 30, 2023 at 16:49
  • $\begingroup$ Are you interested in the risk of mutagenicity, or forecasting which molecules will undergo mutagenicity $\endgroup$ Commented Jun 30, 2023 at 16:53
  • $\begingroup$ @DemetriPananos forecasting $\endgroup$ Commented Jun 30, 2023 at 16:54
  • 1
    $\begingroup$ What is left unclear from Harrell’s answer in the second question and cited as a duplicate in the first? I see no disagreements or debates. $\endgroup$
    – Dave
    Commented Jun 30, 2023 at 17:12

1 Answer 1

2
$\begingroup$

Neither one is good, though parts of 2 are better than all of 1.

Option 1 relies on dichotomizing the predicted probabilities using a threshold. Different thresholds give different values for all of these KPIs, and if you want to use a single threshold at all, you should choose it with a clear view to the decision being supported by the model. So the threshold is not a function of the model alone any more, but also of the subsequent decision. Therefore any KPIs that rely on this threshold will not depend only on the quality of the model. Accuracy and related KPIs like precision, recall etc. have major issues.

Parts of option 2 make sense, specifically $R^2$, which is essentially the MSE, which in turn is the Brier score. This is good. However, the MAE is not good, because optimizing on it will incentivize you towards heavily biased predictions: if your predicted probability for a given instance is larger (smaller) than 0.5, you will very probably reduce the MAE if you change this predicted probability to 1 (0). Optimizing the MAE is thus equivalent to optimizing accuracy - see above.

The accepted way to evaluate probabilistic predictions is to use a proper scoring rule. One such scoring rule is the Brier score, which is equivalent to $R^2$, which is why this is a least-bad option among the ones you suggest - but it makes more sense to explicitly work in terms of scoring rules, and to make use of the machinery and the theoretical results that have been developed around them.

However, note that if you are working in a specific decision context and understand the costs of various actions you could take in response to a probabilistic prediction, then it may make more sense to evaluate the entire model-decision workflow, because just optimizing the (say) Brier score will not necessarily give you the best decision (Assel et al., 2017).
$\endgroup$
2
  • $\begingroup$ A big +1. To a large extent due to your posts, I now find it quite frustrating to see classification metrics calculated for logistic regression models, since any such metric applies to the logistic regression model along with a decision rule for how to use the predictions, and this decision rule is distinct from the regression. // The concern I have with $R^2$ is the ambiguity in how to calculate it. Sure, we might say it’s obviously $1-RSS/TSS$, but plenty of people will square a correlation. Given the notation, this kind of makes sense, despite the potential problems. $\endgroup$
    – Dave
    Commented Jun 30, 2023 at 18:02
  • $\begingroup$ @Dave: the other problem with the $R^2$ is that there are multiple competing definitions of it in the context of logistic regression, see stats.stackexchange.com/q/3559/1352. $\endgroup$ Commented Jul 1, 2023 at 7:39

Your Answer

By clicking “Post Your Answer”, you agree to our terms of service and acknowledge you have read our privacy policy.

Not the answer you're looking for? Browse other questions tagged or ask your own question.