4
$\begingroup$

Some background information about what I am trying to model before asking my question: Long periods of hot temperatures and dry conditions (heatwaves) puts pressure on the components in the power distribution grid and eventually cause faults.

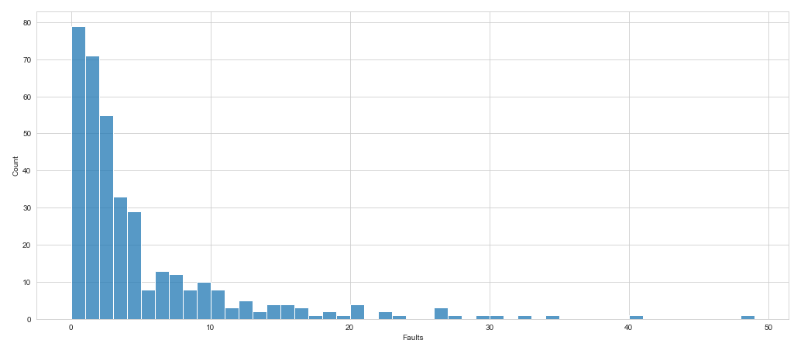
My ultimate goal is to predict whether a power grid is in high risk, medium risk or low risk based on the prediction of number of faults by using machine learning algorithms. I have the dataset which have the features such as: temperature, humidity, power flowing throughout the grid etc. compiled daily for the summer periods of several years. As for the the dependent variable, I have the daily number of faults occured in my target grid. To illustrate, the distribution of the number of the faults in my dataset can be seen below.

Number of Faults

As far as I can imagine, there are several ways to tackle this problem.

  • I can use a regression algorithm first to predict the number of faults and then classify the risk level by using a threshold on the predicted fault values. Also I can add to this model some measure of how confident I am in my classification based on how far I am from the threshold.
  • I can transform my dataset's dependent variable (number of faults) into multiclasses ,using a threshold, and tackle the problem as a multiclass classification problem. I think this can overlook the severity of the number of faults in some days and worsen the performance of my model

The first one seems more promising but still I have doubts about whether using regression where my ultimate goal is classification is a wise thing to do. How should I tackle this problem? Any other recommendation is well appreciated.

$\endgroup$
2
  • 9
    $\begingroup$ why not just model the number of faults - why classify afterwards? $\endgroup$ Commented Jul 9, 2023 at 1:21
  • 4
    $\begingroup$ "My ultimate goal is to predict whether a power grid is in high risk, medium risk or low risk". IMHO that is not a good goal. Just predict risk and do a rigorous validation of its calibration. $\endgroup$ Commented Jul 9, 2023 at 15:48

4 Answers 4

12
$\begingroup$

Welcome to the site.

The first part of the first choice seems much better to me; you could use some form of count regression, probably negative binomial (the assumptions of Poisson regression are hardly ever met).

What to do next depends on why you are classifying. Categorizing continuous things is often a mistake. It throws away information. After you do the regression, you will be able to give the predicted probability of any particular number of faults, with confidence intervals.

Then you have to think about how to present this. This will depend on your audience, and also on the consequences of any particular number of faults. I am guessing that the risk of a catastrophic failure (like a whole city losing power) are related in a complicated way to the number of faults. Categorizing this into "high" "medium" etc. might be necessary for presentation to the public, or to people who are not numerate. But (hopefully) the people making the decisions about what to do are numerate, and you should present the more detailed information. More information ought to lead to better decisions.

$\endgroup$
6
$\begingroup$

“High risk” of what? You are predicting the number of failures, so if you aim to predict if there's a risk of failure, anything close to or higher than 1 failure is a risk. On another hand, if you mean the risk of multiple failures, how many counts as “multiple”? Again, the threshold is self-explanatory. Finally, if you are predicting a risk of a grid failure that is not a mere function of the number of failures (but maybe also their quality or kinds), it means that there is no threshold. In each case, the threshold is something to be determined by some stakeholder or a domain expert. It may be the case that it is an arbitrary cut-off.

Another thing you could do is to obtain the threshold empirically. If you know that when the number of failures exceeded some threshold, then historically something bad has happened, use this threshold. However, for this, you need data labeled for the somethings bads happening. If you had such data, why not use it directly to build a binary classifier?

$\endgroup$
5
$\begingroup$

While the classification (and optimizing some cost function relating to that classification) might be your ultimate goal, it is useful to 'fit your model based on the model'. That means: to fit the model based on the relevant cost function that minimizes the estimation proces with respect to the variations in that statistical model (and that may not need to be the cost function that is to be optimized in the final goal).

If you would fit directly the final cost function, with the classes, then you may get a lower performance.

What you care about is making predictions with the least amount of error, and that is done by taking into account the underlying statistical model, instead of the final goal/cost function. A related question is: Could a mismatch between loss functions used for fitting vs. tuning parameter selection be justified? The cost function to be optimized in fitting the model, can be different from the cost function that is the goal of the regression.

$\endgroup$
1
$\begingroup$

This is probably, at some level, a resource allocation and prioritisation problem - given a limited budget, which things should be repaired first?

A ranking is is much more useful to this end than a broad categorisation, and so a granular score from a regression model seems preferable to a classification with somewhat arbitrary cutoff points.

$\endgroup$

Your Answer

By clicking “Post Your Answer”, you agree to our terms of service and acknowledge you have read our privacy policy.

Not the answer you're looking for? Browse other questions tagged or ask your own question.