Update (2024/08/10): I have added some additional points of consideration and citations to enhance the previous answer written here. Otherwise, the answer as a whole is essentially the same.
As Ben noted in the comments, there are no APA standards for reporting mixed models. However, there are certainly a good number of important parts about your analysis that should be included if this is for a published manuscript. A useful paper on this subject is Meteyard and Davies (2020), which includes many of the points below. I have also updated this list to include some additional considerations, which I signify with a * sign:
- Software and version used.
- What data cleaning/wrangling was involved and whether or not your data meets the assumptions of mixed models.
- Fixed and random effects are explicitly noted with important theoretical underpinnings noted for how the model was constructed.
- Sample size in terms of units of observations (50 subjects x 10 items = 500 observations for crossed effects models).
- Whatever model comparison was employed and the metrics that go with that (such as AIC/BIC).
- Convergence issues and how they were handled.
- The model equation and output (normally reported in a table), which includes pretty much everything it spits out (point estimates, standard errors, etc) as well as model fit metrics (pseudo R2 values for example).
- If possible, the data and code itself.
- The number of clusters and features of those clusters (e.g. how many observations per cluster) can be very useful to include, particularly given that we know clusters can have a sizeable impact on the results (Austin & Leckie, 2018; Clark, 2008).*
- Partial effect sizes for individual effects. These have become more common to report, such as part $R^2$ and $f^2$, along with the model pseudo $R^2$ values mentioned previously (Lorah et al., 2018; Nakagawa et al., 2017; Stoffel et al., 2021).*
- For a study which analyzed original data using a frequentist paradigm, it is essential to also include a power analysis (see Kumle et al. 2021 and Kain et al. 2015 for how to do this). A Bayesian version may include a ROPE instead (Kruschke & Liddell, 2018).*
- Visualizing the results. The Meteyard & Davies article shows some visualizations of mixed modeling (though this isn't an exhaustive or always typical list of plots). I would argue this part of reporting is one of the most essential, as taking one's word for it from a table alone isn't sufficient (particularly for seeing if a model is very misfit). Since many mixed models are fit with R, the sjPlot package is a great tool if you want a simple method for visualizing the results.*
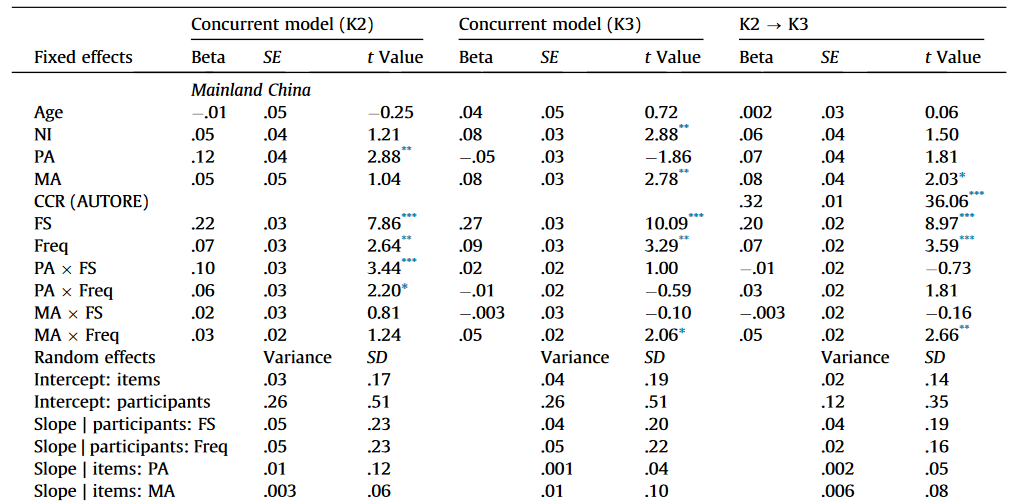
Here is an example from an article which includes a good number of these things but not all of them. They include the fixed effects on the top and the random effects on the bottom, along with the beta coefficients, the standard errors, and the t-values that go with them (I only include part of it here because its very long:

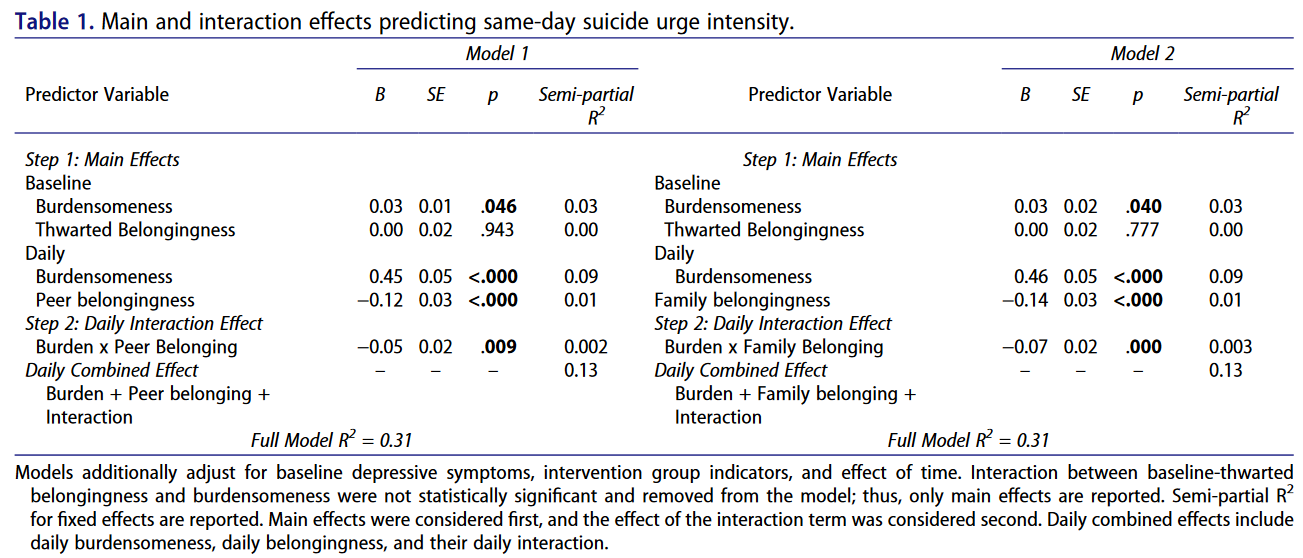
And another example here, where you can see they included the actual equations, R2 values, and p values:

Reporting of these models varies a lot. More is always better, so include as much as possible and try to follow the guides I have cited here.
Citations
Best Practice Guides
- Brown, V. A. (2021). An introduction to linear mixed-effects modeling in R. Advances in Methods and Practices in Psychological Science, 4(1), 1–19. https://doi.org/10.1177/2515245920960351
- Harrison, X. A., Donaldson, L., Correa-Cano, M. E., Evans, J., Fisher, D. N., Goodwin, C. E. D., Robinson, B. S., Hodgson, D. J., & Inger, R. (2018). A brief introduction to mixed effects modelling and multi-model inference in ecology. PeerJ, 6, e4794. https://doi.org/10.7717/peerj.4794
- Meteyard, L., & Davies, R. A. I. (2020). Best practice guidance for linear mixed-effects models in psychological science. Journal of Memory and Language, 112, 104092. https://doi.org/10.1016/j.jml.2020.104092
Example Studies
Al-Dajani, N., & Czyz, E. K. (2022). Suicidal desire in adolescents: An examination of the interpersonal psychological theory using daily diaries. Journal of Clinical Child & Adolescent Psychology. https://doi.org/10.1080/15374416.2022.2051525
Wang, L., Wang, J., Liu, D., & Lin, D. (2021). The role of metalinguistic awareness and character properties in early Chinese reading. Journal of Experimental Child Psychology, 210, 105185. https://doi.org/10.1016/j.jecp.2021.105185
Papers on Power/ROPE
- Kain, M. P., Bolker, B. M., & McCoy, M. W. (2015). A practical guide and power analysis for GLMMs: Detecting among treatment variation in random effects. PeerJ, 3, e1226. https://doi.org/10.7717/peerj.1226
- Kumle, L., Võ, M. L.-H., & Draschkow, D. (2021). Estimating power in (generalized) linear mixed models: An open introduction and tutorial in R. Behavior Research Methods, 53, 2528–2543. https://doi.org/10.3758/s13428-021-01546-0
- Kruschke, J. K., & Liddell, T. M. (2018). The Bayesian new statistics: Hypothesis testing, estimation, meta-analysis, and power analysis from a Bayesian perspective. Psychonomic Bulletin & Review, 25(1), 178–206. https://doi.org/10.3758/s13423-016-1221-4
Papers on Effect Sizes in Mixed Models
- Lorah, J. (2018). Effect size measures for multilevel models: Definition, interpretation, and TIMSS example. Large-Scale Assessments in Education, 6(1), 8. https://doi.org/10.1186/s40536-018-0061-2
- Nakagawa, S., Johnson, P. C. D., & Schielzeth, H. (2017). The coefficient of determination R2 and intra-class correlation coefficient from generalized linear mixed-effects models revisited and expanded. Journal of the Royal Society, 14. https://doi.org/10.1098/rsif.2017.0213
- Stoffel, M. A., Nakagawa, S., & Schielzeth, H. (2021). partR2: Partitioning R2 in generalized linear mixed models. PeerJ, 9, e11414. https://doi.org/10.7717/peerj.11414
Papers on Cluster Effects
- Austin, P. C., & Leckie, G. (2018). The effect of number of clusters and cluster size on statistical power and Type I error rates when testing random effects variance components in multilevel linear and logistic regression models. Journal of Statistical Computation and Simulation, 88(16), 3151–3163. https://doi.org/10.1080/00949655.2018.1504945
- Clarke, P. (2008). When can group level clustering be ignored? Multilevel models versus single-level models with sparse data. Journal of Epidemiology & Community Health, 62(8), 752–758. https://doi.org/10.1136/jech.2007.060798


