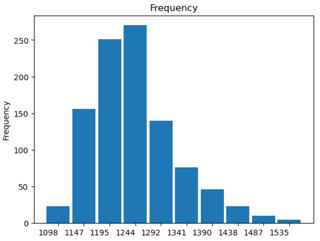
I have a dataset comprising 1000 integers. It represented as follows:
1235, 1284, 1258, 1284, 1162, 1286, 1333, 1235, 1286, 1315, 1240, 1488, 1346, 1188,
1201, 1188, 1152, 1260, 1240, 1346, 1240, 1343, 1196, 1359, 1219, 1266, ...
The histogram doesn't appear to be normally distributed.
A Shapiro-Wilk test (scipy.stats.shapiro) returned 0 p-value.
data = [1235, 1284, 1258, ...]
scipy.stats.shapiro(data)
The dataset has a positive skewness of 0.9083 with a long tail in the right side. The histogram is similar to a Poisson distribution. So I ran the Kolmogorov-Smirnov test (scipy.stats.kstest), which also returned negative (zero p-value):
loc = min(data)
mu = np.mean(data)-loc
scipy.stats.kstest(data,"poisson",args=(mu,loc),alternative="greater",N=1000)
What are the correct values for mu and loc in this kstest? I used the minimum value for loc and "mean - loc" for mu. In this case, I used the following values
mu=168.349 loc=1098
I think mu value 168.349 is too large for a Poisson distribution. What is the correct way to test if the dataset is Poisson distribution or not?

