In simple linear regression, the variance of the residuals is given by $Var(e_i) = \sigma^2\Big(1 - \dfrac{1}{n} - \dfrac{(x_i-\bar{x})^2}{n\cdot s_x^2}\Big)$. This is obviously not constant.
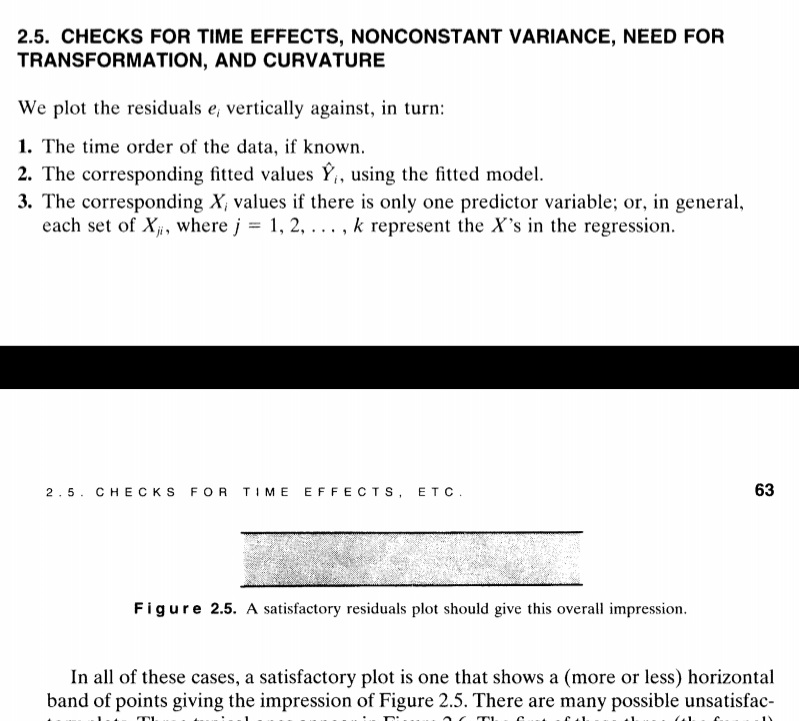
A commonly used diagnostic plot is the residual vs predictor plot, in which we plot the $e_i$ versus $x_i$. And apparently, this diagnostic plot is satisfactory, if the plot is a (more or less) constant-width blur of points around a straight, flat line at height zero.
I get the 'height zero' part (reason being that $E[e_i]=0$ ). but i do not understand why residuals should roughly form a "horizontal band" around the $\text{residual}=0$ line. The residuals are not error terms. so just because the error terms have been assumed to be of constant variance does not mean that residuals will also have constant variance.
I mean it can happen that as i increases $x_i$ increases and hence $Var(e_i)$ decreases , in which case the residual vs predictor plot would be funnel shaped.
So, why should residual vs predictor plot form a "horizontal band" around the $\text{residual}=0$ line?
edit:- in response to @whuber's comment, to support my claim, i am posting an image that is an excerpt from the book applied regression analysis by draper and smith. 
