0
$\begingroup$

I'm doing a hierarchical regression trying to understand how intelligence (first predictor) and personality traits (second predictor) influence general knowledge (dependent variable). The problem is that the intelligence test is positively skewed since my sample consisted of above-average individuals. Shapiro-Wilk W is significant, the skewness value is 1.32 and the q-q plot differs from theoretical distribution. I'm not sure what to do about this, can I try and log-transform just the data for intelligence? I've never done transformations of non-normal data so I'm not sure of the procedure and does it come with some caveats.

I'm still getting a positive correlation between intelligence and general knowledge (0.36) but I'm sure that it's bigger in reality, as my intelligence test was not discriminative enough and its variance should be larger. What would you suggest me to do?

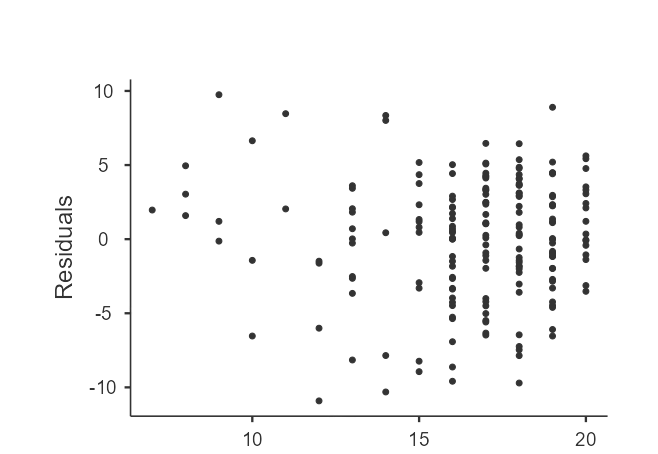
Edit: I'm adding a picture of the residuals plot for the whole model: enter image description here
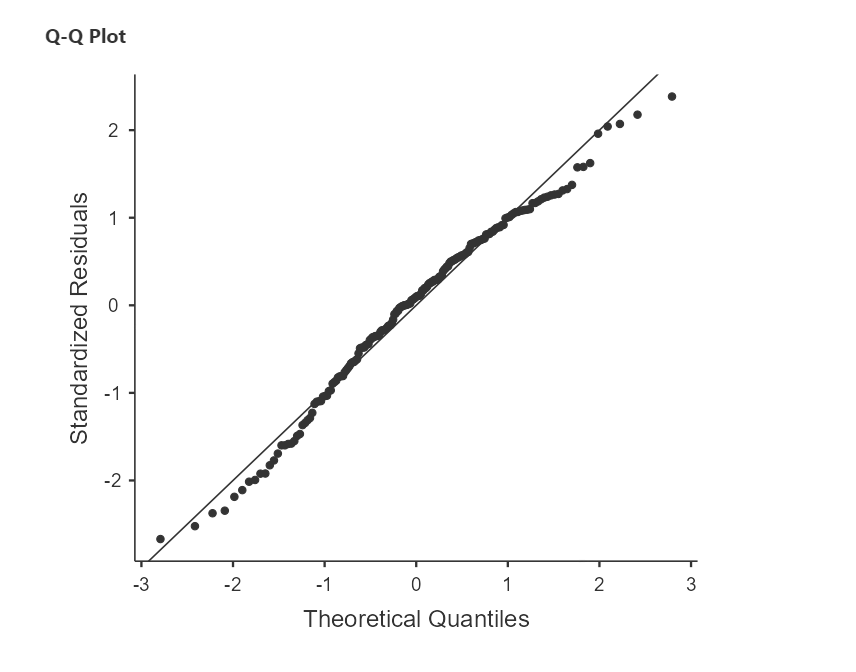
and a picture of the residuals of the intelligence test: enter image description here

$\endgroup$

2 Answers 2

1
$\begingroup$

Your predictors do not need to be normally distributed at all. (Roughly speaking, not even your residuals need a normal distribution if your sample is large enough.) ANOVA is nothing but a regression on Boolean 0-1 predictors, these are about as non-normal as they can be. Just run your model, and transform only if your prior knowledge leads you to expecting a relationship that is not linear.

$\endgroup$
1
  • $\begingroup$ Thank you for your help. $\endgroup$
    – sticker
    Commented Aug 29, 2023 at 17:11
1
$\begingroup$

In addition to Stephen's excellent answer, if you do plot the residuals and find they are severely non-normal (and your sample size isn't huge) you can run quantile regression or robust regression. I would do this rather than transform, especially if your measure of intelligence is one of the familiar IQ tests (WAIS or SB) where mean = 100 and sd = 15. Log of that isn't as easy to interpret or relate to.

Also, you mention you have "above average" people. This could be a reason for a lower than expected correlation. There is a problem called restriction of range. Like this (R code with comments):

set.seed(1234)

IQ <- rnorm(1000, 100, 15)
genknow <- IQ*5 + rnorm(1000, 0, 100)
cor(IQ, genknow)  #0.61

cor(IQ[IQ > 130], genknow[IQ > 130]) #0.11
$\endgroup$
4
  • $\begingroup$ Thank you for your answer. This is how my residuals plot looks like: imgur.com/a/4GiVt4t And sample size is 191. I'm not sure what to do $\endgroup$
    – sticker
    Commented Aug 29, 2023 at 17:20
  • $\begingroup$ That link gives lots of warnings. You ought to be able to just post the plot in your question. $\endgroup$
    – Peter Flom
    Commented Aug 29, 2023 at 17:58
  • $\begingroup$ Yeah, sorry I don't know why that happens, I'll edit my question with the screenshot of the plot $\endgroup$
    – sticker
    Commented Aug 30, 2023 at 9:02
  • $\begingroup$ I've added the screenshots to my question $\endgroup$
    – sticker
    Commented Aug 30, 2023 at 16:58

Your Answer

By clicking “Post Your Answer”, you agree to our terms of service and acknowledge you have read our privacy policy.

Not the answer you're looking for? Browse other questions tagged or ask your own question.