1
$\begingroup$

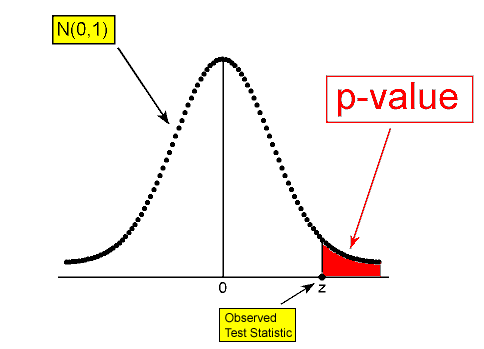
As I understand it, p-values are derived from a test statistic, which measures how unlikely it is that we would get those data, assuming the null hypothesis is true.

But if this is the case, would it not be impossible to detect a statistically significant difference if the means of the two distributions are close enough?

enter image description here

For instance, if an effect size is considered small, how could it ever be the case that the mean of the blue distribution would ever reach a p-value of p < .05? I know conceptually that the higher the N, the lower the p-value. But how is this actually possible? My intuition is that as sample size goes up, the distribution narrows; but it's not like higher sampling actually changes the population SD. Why, then, is it the case that the higher the N, the lower the p-value? enter image description here
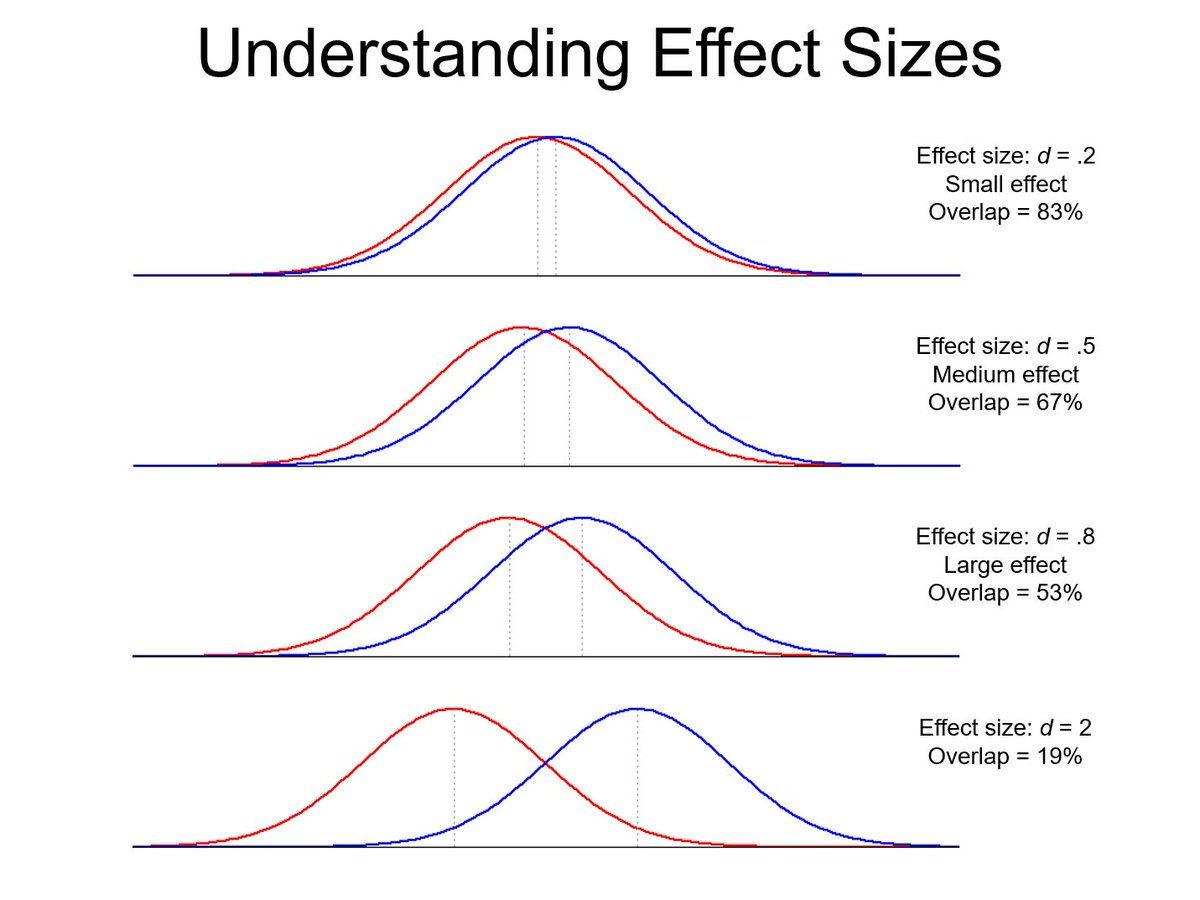
In short, isn't it possible that two distributions could be sufficiently close to each other that they could, in principle, never be statistically significantly different from one another? This question has been killing me. Any insight would be appreciated!

$\endgroup$
2
  • 5
    $\begingroup$ The standard deviation might not depend on the sample size, but what about the standard error? (The terms are not synonymous.) $\endgroup$
    – Dave
    Commented Oct 5, 2023 at 21:44
  • $\begingroup$ i think this may be my source of confusion. when doing a z- or a t-test, the two distributions you're comparing are the distributions of sample means. therefore it is standard errors (i.e., not standard deviations), and those will minimize with a larger N? does that sound correct? and furthermore, how do you get a distribution of sample means when, for instance, in an experiment, you only have ONE mean value per group. How can you create a distribution of means when you only have one value per group? $\endgroup$
    – BigNate
    Commented Oct 7, 2023 at 19:41

1 Answer 1

1
$\begingroup$

You need to compare the distributions of the corresponding sample means. The sample means are $\overline{X}_{1/2}=\frac{1}{N}\sum_i X_i \sim \mathcal{N}(\mu_{1,2},\sigma_{1,2}/\sqrt{N})$.

Therefore, the distribution of the sample means get narrower with increasing sample size N. At some sample size N, the two distributions of the sample meams become distinguishable.

If you want to construct a test and a p-value, I suggest looking into a permutation test (or a bit different a bootstrap test).

In the permutation test, you draw samples from both distributions and compute the difference of the means of two groups (the difference will on average be zero). At some big sample size you will observe that the original difference of means gets a low p-value.

However, if the sample size is not big enough, a small difference in means might stay unnoticed (due to too high p-values).

$\endgroup$
2
  • $\begingroup$ i think i was confused about the fact that the distributions compare sample means. but here is an outstanding question: when doing an experiment, for instance, you're only getting ONE mean for each group. How is a distribution created for sample means when there is only one mean collected? $\endgroup$
    – BigNate
    Commented Oct 7, 2023 at 19:43
  • $\begingroup$ Have a look at bootstraping $\endgroup$
    – Ggjj11
    Commented Oct 7, 2023 at 21:48

Your Answer

By clicking “Post Your Answer”, you agree to our terms of service and acknowledge you have read our privacy policy.

Not the answer you're looking for? Browse other questions tagged or ask your own question.