The MAPE could be employed in the context of regression problem and is defined by $$ MAPE := \frac{1}{n} \sum_{t=1}^{n} \left| \frac{y_{t} - \hat{y}_{t}}{y_{t}} \right| $$ where $y_{t}$ is target value and $\hat{y}_{t}$ is fitted value. In my intuition, it could be naturally generalized by $$ gMAPE := \frac{1}{n} \sum_{t=1}^{n} \frac{\left\| \mathbf{y}_{t} - \hat{\mathbf{y}}_{t} \right\|}{\left\| \mathbf{y}_{t} \right\|} $$ where $\left\| \cdot \right\|$ is any norm of a vector, but I have noticed there isn't reference or any mention about it. Is it weird or wrong? I think $gMAPE$ is more reasonalbe and useful in many case compare to univariate target(Empirically, '$\mathbf{y}_{t}$ must be not zero-vector' a is easier condition than '$y_{t}$ must be not zero' is '$\mathbf{y}_{t}$ must be not zero-vector'), why nobody is interested it?
-
$\begingroup$ As much as MAPE has issues, it makes sense. Anyone with scientific acumen should understand that predictions tend to be within $10\%$ or $30\%$ of the true values. Even as a statistician, I struggle to have an interpretation of your proposed calculation, though you most certainly can calculate it for multivariate outcomes (if you really do have a multivariate outcome). I think I might prefer something like a double sum over the observations and the outcome variables, however. $\endgroup$– DaveCommented Jan 7 at 6:00
-
1$\begingroup$ @Dave Good point. Even if we ignore the division, I find $\Vert y_t -\hat y_t \Vert $ not very intuitive. The minimizer would be some sort of multidimensional median... $\endgroup$– picky_porpoiseCommented Jan 7 at 11:15
-
1$\begingroup$ @picky_porpoise With an $\ell_2$ norm, wouldn’t it be a multivariate mean? $\endgroup$– DaveCommented Jan 8 at 9:02
-
$\begingroup$ @Dave Would be if the norm was squared, but like this its hard to interpret. But probably closer to the mean, yes $\endgroup$– picky_porpoiseCommented Jan 9 at 14:18
-
1$\begingroup$ @Dave The square root applies to the norm of each pair of forecast and observation individually, so it's not that easy. We can see this in the one dimensional case: The square root of the squared error is simply the absolute error, yet it is clear that mean squared error and mean absolute error are minimized by different statistics. $\endgroup$– picky_porpoiseCommented Jan 9 at 21:52
2 Answers
Similar distances are used in literature since mid last century, e.g. so called Canberra distance: $$\sum_t\frac{|y_t-\hat y_t|}{|y_t|+|\hat y_t|}$$
There are issues with Euclidian distances in high dimensions, of course. There's also a problem of units of measure and scales if the dimensions represent different features. So, as long as you understand limitations I don't see the reason to outright reject your distance metric.
If your data has a natural zero and all dimensions were of the same scale and UoM, then this should be quite reasonable. For instance, if we were providing a cartesian coordinate of a drone to shoot down $y_t$ and the actual cartesian coordinate of a projectile's explosion point $\hat y_t$, then your measure would give a reasonable measure of how close you got it in percentages. In this case if the center of the coordinate system is at the location of a gun, then we have a natural zero too.
-
$\begingroup$ Maybe it's called by sMAPE(symmetric mean absolute percentage error) also, at least in wikipedia. In your reference, I found the sentence "...it calculates the absolute difference between two vectors and normalizes it by dividing it by the absolute sum of their values. ...". It's what I wanted. Popular, famous, verificated and most important between two 'vectors'. Thank you so much. $\endgroup$ Commented Jan 7 at 17:32
-
2$\begingroup$ In forecasting, this error measure (more specifically, twice it) is indeed known as a "symmetric MAPE" and has been discussed at least since Goodwin & Lawton (1999, IJF). I am amused that the ML community is once again reinventing a wheel. CV threads on the symmetric MAPE are here and here. $\endgroup$ Commented Jan 7 at 17:59
-
$\begingroup$ @StephanKolassa, ML community was using Canberra distance since at least 1967 $\endgroup$– AksakalCommented Jan 7 at 22:48
-
$\begingroup$ @Aksakal: ah, thank you. I see I am hoist with my own petard... $\endgroup$ Commented Jan 8 at 11:32
In principle and in theory, you can do this. However, I would definitely try to understand this error measure well before using it in any serious use case. I would recommend you take a look at What are the shortcomings of the Mean Absolute Percentage Error (MAPE)? for the univariate case.
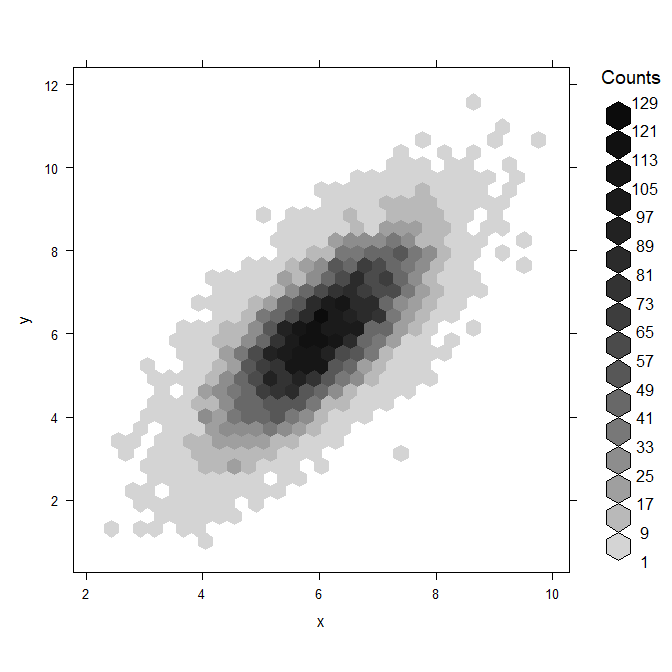
The next step would be to simulate two-dimensional data and get a handle on what functional of this known distribution your gMAPE elicits. For instance, assume your conditional actuals look like this:
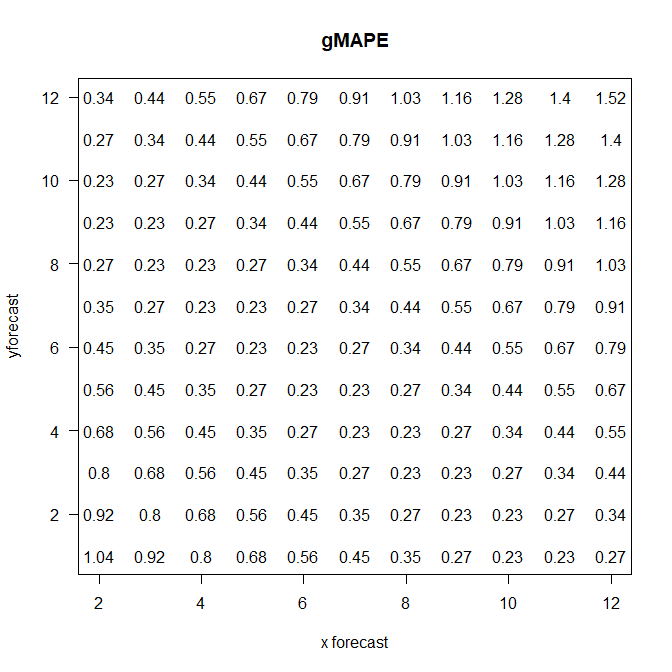
We can now run over a grid of possible two-dimensional forecasts and assess how well they would do to predict these simulates, as evaluated using the gMAPE:
Now, it seems like the gMAPE is indeed minimized near the mean $\mu$ (per the link above, it probably won't be minimized by the exact mean), but it seems to have a very hard time understanding that other values on the top left-bottom right do not make sense. As a matter of fact, this looks so strange to me that I probably have a bug in my code somewhere... but I will leave this up as a possible way to investigate and understand the properties of the gMAPE.
R code (possibly buggy):
library(MASS)
library(hexbin)

mu <- c(6,6)
Sigma <- rbind(c(1,1),c(1,2))

n_sims <- 1e4
set.seed(1)
sims <- data.frame(mvrnorm(n_sims,mu,Sigma))
colnames(sims) <- c("x","y")
sims_matrix <- as.matrix(sims)
hexbinplot(y~x,sims)

fcsts <- as.matrix(expand.grid(x=seq(floor(min(sims$x)),ceiling(max(sims$y)),by=1),
    y=seq(floor(min(sims$y)),ceiling(max(sims$y)),by=1)))

fcsts <- cbind(fcsts,
    apply(fcsts,1,function(fcst)mean(sqrt(rowSums(sims_matrix-matrix(fcst,nrow=n_sims,ncol=2,byrow=TRUE))^2)/sqrt(rowSums(sims_matrix^2)))))
colnames(fcsts)[3] <- "MAPE"

plot(fcsts[,1],fcsts[,2],type="n",xlab="x forecast",ylab="yforecast",main="gMAPE",las=1)
text(fcsts[,1],fcsts[,2],round(fcsts[,3],2))
-
$\begingroup$ Thank you for answer, please take a look mine! $\endgroup$ Commented Jan 7 at 16:07


