I was doing some simulations on the Mann-Whitney U test. I collected a number of U statistics (U is the smallest number of wins out of all pairwise contests between 2 samples: compare all values of sample A to all values of sample B -nAnB total comparisons- add 1 to UA if the A sample was the largest, otherwise add 1 to UB, then take the smallest of UA or UB. In fact, you can take either one of UA or UB, but...) Then I thought about doing a simple binomial test on this U value, akin to the basic SIgn test: under the null (no stochastic dominance), the expectation is that UA=UB=nAnB/2. So I computed the probability of observing U (or even more extreme) under the null, just as one would for the Sign test. But when I do that in the simulation, comparing 2 samples from the same normal distribution, the Type I error rate is very large (way higher than for the Mann-Whitney test, which seems to be well controlled, at least inder these conditions). I have a hard time understanding why the binomial test fails so badly: it seems to me to be the same logic as for the Sign test. I look at all the pairwise comparisons between the 2 samples, count how many times sample A "wins", and then see if that is compatible with the null (UA~= 50%), via a binomial test. However, in a simple case wher the NULL is true, that approach rejects the null way too often. Can anyone explain where the flaw in the approach/reasoning is?
2 Answers
The pairwise comparisons are not independent
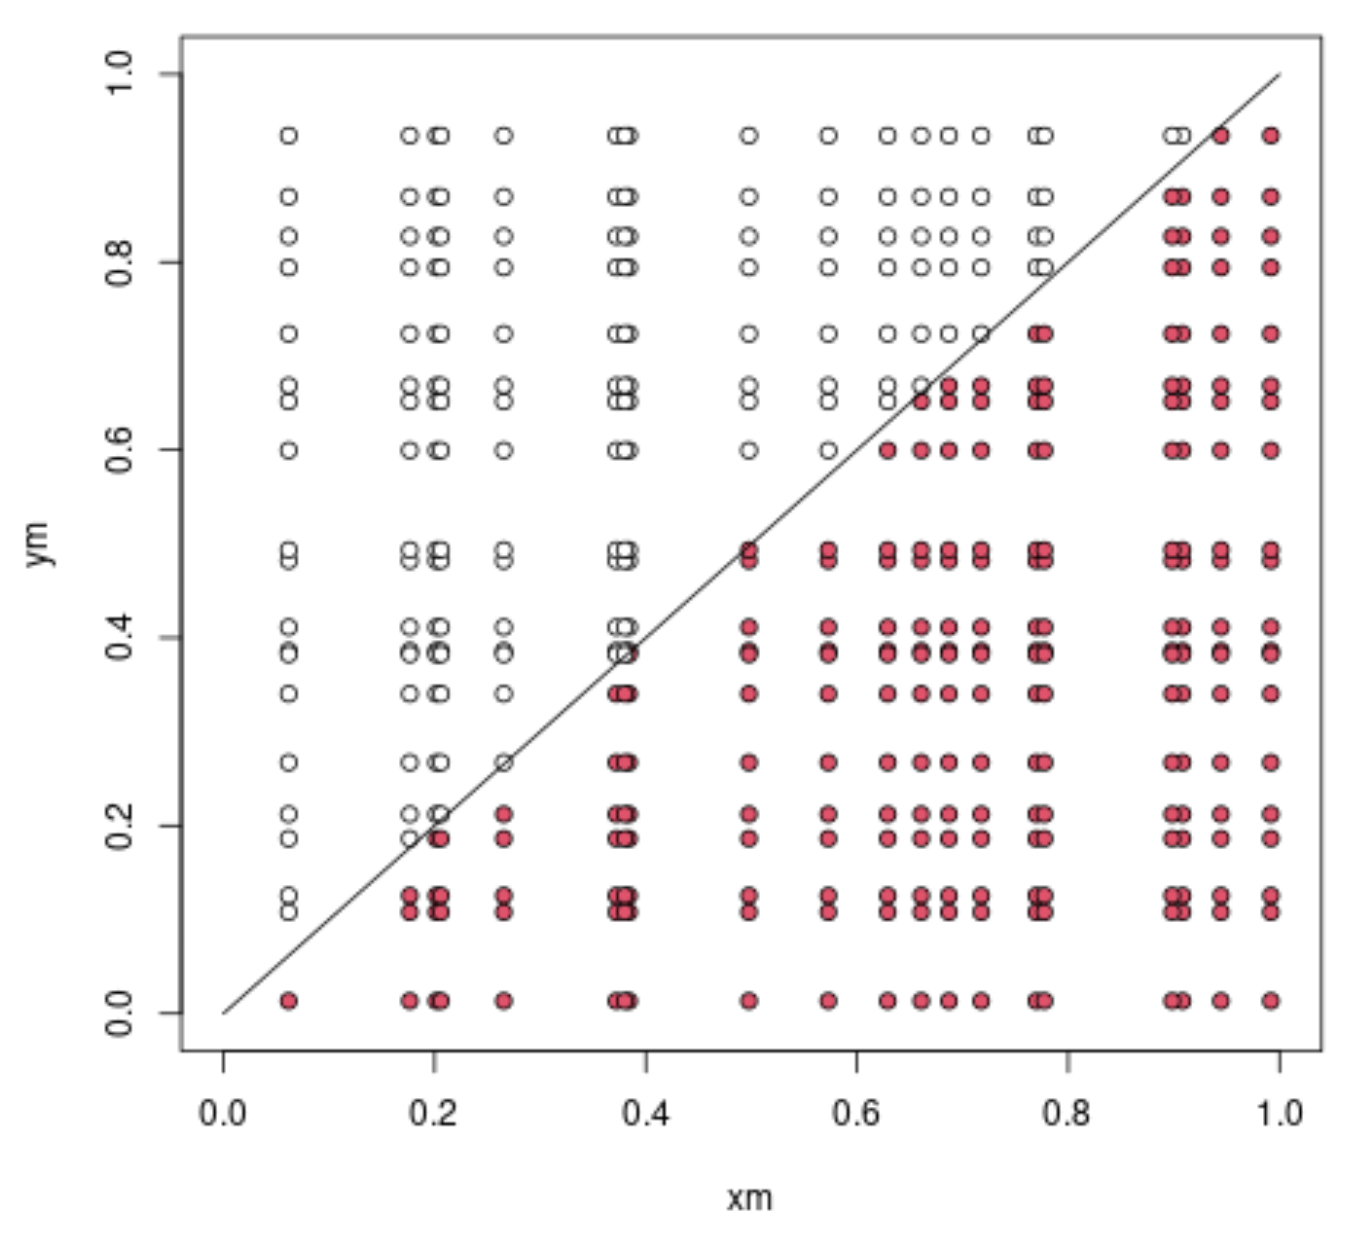
One way to consider the computation of the $U$ statistic is by making from the $n_1$ samples $X$ and $n_2$ samples $Y$ a number of $n_1\cdot n_2$ pairwise comparison. An example below is for two uniform distributed samples where all comparisons are placed in a scatter plot.
n = 20
set.seed(1)
x = runif(n)
y = runif(n)

xm = outer(x,y,function(x,y) x)
ym = outer(x,y,function(x,y) y)

plot(xm,ym,
     xlim = c(0,1), ylim = c(0,1),
     pch= 21,
     bg = (xm>ym)*2)

lines(c(0,1),c(0,1))

sum(xm>ym) #result: 230
With $X>Y$ for 230 out of 400 comparisons the $Y$ values are relatively small in this sample.
Now imagine adding another value to the sample $X$. Is this like making 20 additional independent Bernoulli draws? No, it depends on the current values of $Y$. And if the current value of U is already relatively large, then it is likely that the next addition is gonna be large as well. Say this value $X$ is an average $0.5$, then it will beat $12$ out of $20$ of the $Y$ values.
A similar (but more thorough) inductive reasoning has been used by Mann and Whitney to derive the properties of the distribution of the U statistic. For example, we can express the variance of the distribution of a sample of size $n_1 = 20, n_2 = 21$ with the variance of the distributions of a sample of size $n_1 = 19, n_2 = 21$ and $n_1 = 20, n_2 = 20$
An alternative approach for the variance is to consider $n_1$ draws out of a discrete uniform distribution with values $1$ to $n_t = n_1 + n_2$.
A single draw has a variance
$$\frac{n_t^2-1}{12}$$
$n_1$ draws will have a variance
$$n_1 \cdot \frac{n_t^2-1}{12}$$
but with a finite population correction (draws without replacement) that will become
$$n_1 \cdot \frac{n_2}{n-1} \cdot \frac{n_t^2-1}{12} = \frac{n_1n_2(n_t+1)}{12}$$
-
$\begingroup$ Thank you for the answer. I had guessed that it had to do with lack of independence (that is about the only assumption which could be broken, so... but could not see why the paired differences would not be independent: the X's are all independent, so are the Y's, so the paired differences should also be independent...). And I think the paired differences ARE independent. But the test is not on the values of the paired differences: it is on the count of the signs of the paired differences. tbc $\endgroup$ Commented Feb 8 at 20:31
-
$\begingroup$ ...cont. Another way to look at this is that, if I sort all X's from lowest up, and compare x1 (lowest) to all Y's, I get a contribution to the total Ux (call it Ux1). Now if I pick the x2, its contribution Ux2 can only be equal or larger to Ux1... etc. Hence the contribution of each xi to the final total U is not independent: it depends on the rank of xi... Is that a valid interpretation? $\endgroup$ Commented Feb 8 at 20:35
-
1$\begingroup$ @jginestet you state that “the paired differences ARE independent”. That is not correct. The paired differences occur among pairs where variables are used repeatedly. For example for three variables $X,Y,Z$, the difference $X-Y$ is not independent from the difference $X-Z$. $\endgroup$ Commented Feb 9 at 9:39
-
$\begingroup$ With the sign test each measurement is only used once in a pair. So for two times $n$ measurements, there are only $n$ paired comparisons. With the U test there are $n^2$ comparisons being created. $\endgroup$ Commented Feb 9 at 9:41
Your $n_An_B/2$ comparisons aren't all independent, so their sum doesn't have a Binomial distribution; it has a distribution with larger variance than a Binomial, so your test assuming Binomial rejects too often.

