7
$\begingroup$

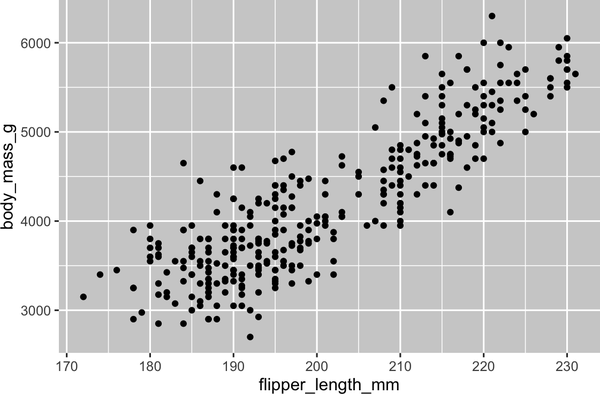
If I have continuous x and y variables I can fit a simple regression. But I want to know how can I test if the lower and upper values of my variables are associated with different groups as in the figure here even if there's no difference in slope or intercept. Here it looks like there's a group that I could box off at x < 200 & y < 5000.

Adding a grouping factor, y ~ x + group, doesn't seem to work because that assesses a difference in intercept.

enter image description here

$\endgroup$

2 Answers 2

6
$\begingroup$

Formally, I would use the x and y to predict the group variable, something like group ~ x + y, possibly with an interaction.

Basically, what you hypothesize is that, if you colored the points in the posted plot according to the group membership, there would be a red cluster in the bottom left and a blue cluster in the upper right. Therefore, use a regression to see if the two variables, perhaps with an interaction, are predictive of the color (group). With a binary outcome, a logistic regression comes to mind, where I would test the full model (the point location affects the probability of group membership) against an intercept-only model (the point location does not affect the probability of group membership).

Informally, I would plot the points with colors corresponding to the groups.

$\endgroup$
1
  • $\begingroup$ Visually there may be two clusters, which we might call Small Turtles and Big Turtles (or whatever they are). But humans often spot patterns which are not really there. My question is whether there is some other property which makes big Small Turtles more like small Small Turtles than like small Big Turtles. $\endgroup$
    – Henry
    Commented Apr 10 at 2:05
5
$\begingroup$

You could draw density plots of each variable to see if there are gaps in those variables. More formally, you could do a Hartigan dip test. Personally, I sort of see a gap around x = 200, but not y = 5000.

If you want to look at both variables at once, then it depends if you actually have a grouping variable in mind. If so, you could try logistic regression with that variable as the dependent variable. If not, you might try cluster analysis.

But do be careful about making hypotheses after seeing the data.

$\endgroup$

Your Answer

By clicking “Post Your Answer”, you agree to our terms of service and acknowledge you have read our privacy policy.

Not the answer you're looking for? Browse other questions tagged or ask your own question.