7
$\begingroup$

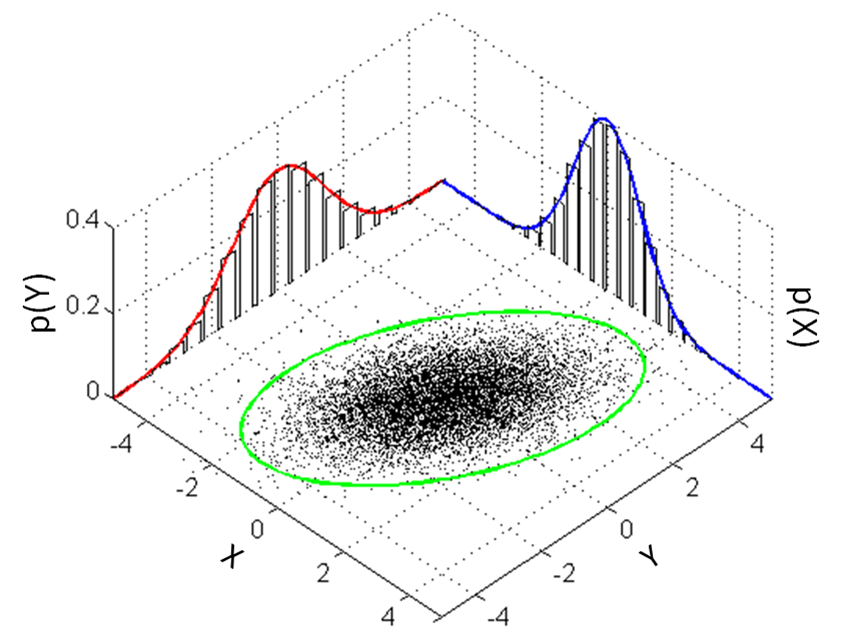
I was trying to understand better the MVN because of some readings on JM vs FCS in the context of Multiple Imputation. Can someone enlighten me on how to visualise a conditional distribution? I understand the theory and the properties. But if I take for example that image from a 2D MVN from Wikipedia

enter image description here

The marginal densities f(X) and f(Y) correspond to the blue and red univariate normal distributions and the joint density f(X,Y) correspond to the distribution of the points in the 2D plan. But how would one develop an intuition/visual image of f(X|Y) or f(Y|X)?

$\endgroup$
3
  • 1
    $\begingroup$ Do you mean (i) "given a specified joint distribution, how would I display some of its conditionals on the same plot as I show some visualisation of the joint density", (ii) "given a large set of data, how would I visualize some (approximation of) conditional distributions empirically", or (iii) "given some data and an estimated model how would I display the model's fitted conditional distributions along with the data"? Or do you seek something else again? Or some combination of those? $\endgroup$
    – Glen_b
    Commented Oct 26 at 23:47
  • 1
    $\begingroup$ I guess mainly (i) and (ii). If I understand well, there would be not much difference between (i) and (ii) if we have a very large dataset (with the assumption of IID/random selection)? But I think that to start simple, if I would take the specific image that I linked (which seem like a large sample of points from a MVN) and wanted to visualise the conditional distributions, would there would be an infinity of these conditional distributions that could be seen as slices of the ellipse? Thanks in advance $\endgroup$ Commented Oct 27 at 0:00
  • 1
    $\begingroup$ Possibly it is to be closed as a duplicate? stats.stackexchange.com/questions/71260 $\endgroup$ Commented Oct 27 at 9:41

1 Answer 1

8
$\begingroup$

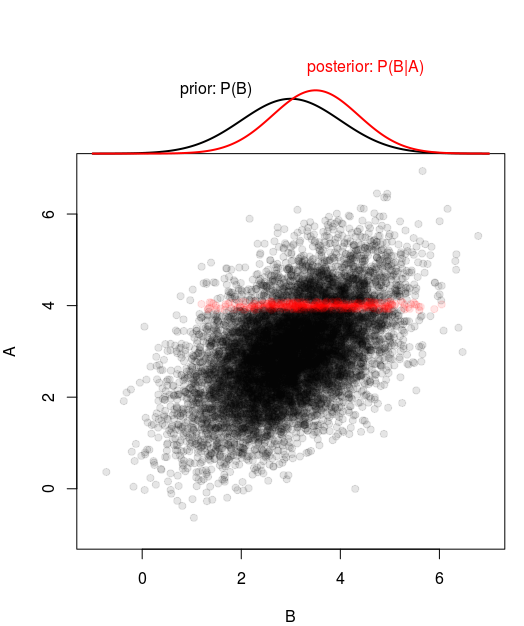
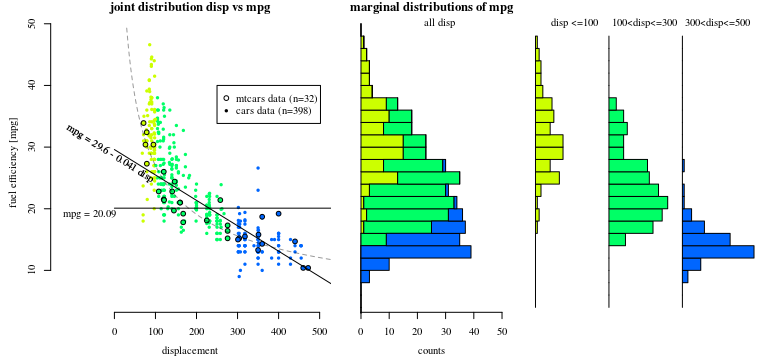
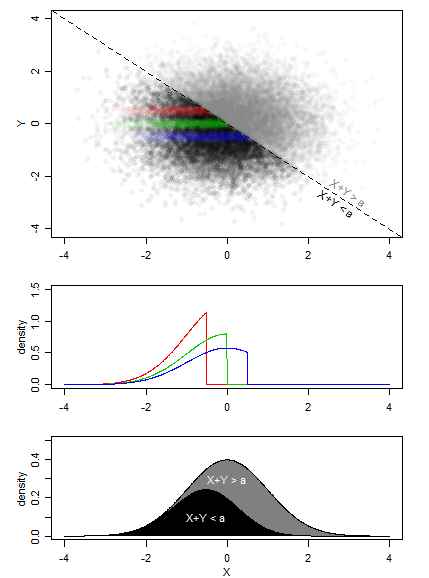
Here are several examples on this website:

marginal and conditional distribution

showcase

example


Another approach are 3d plots where a joint distribution is depicted as a collection of slices, where each slice is a conditional distribution with a scale factor for the probability or density if the condition.

$\endgroup$
2
  • $\begingroup$ Thank you. So if I understand these examples correctly, in the MVN I shared, there would be an infinity of conditional distributions that could be seen as slices of the ellipse? $\endgroup$ Commented Oct 26 at 23:09
  • 1
    $\begingroup$ @SheWonders yes, I visualise it often as slices. But with more complex conditions it can be different and it is more a region. $\endgroup$ Commented Oct 27 at 9:06

Your Answer

By clicking “Post Your Answer”, you agree to our terms of service and acknowledge you have read our privacy policy.