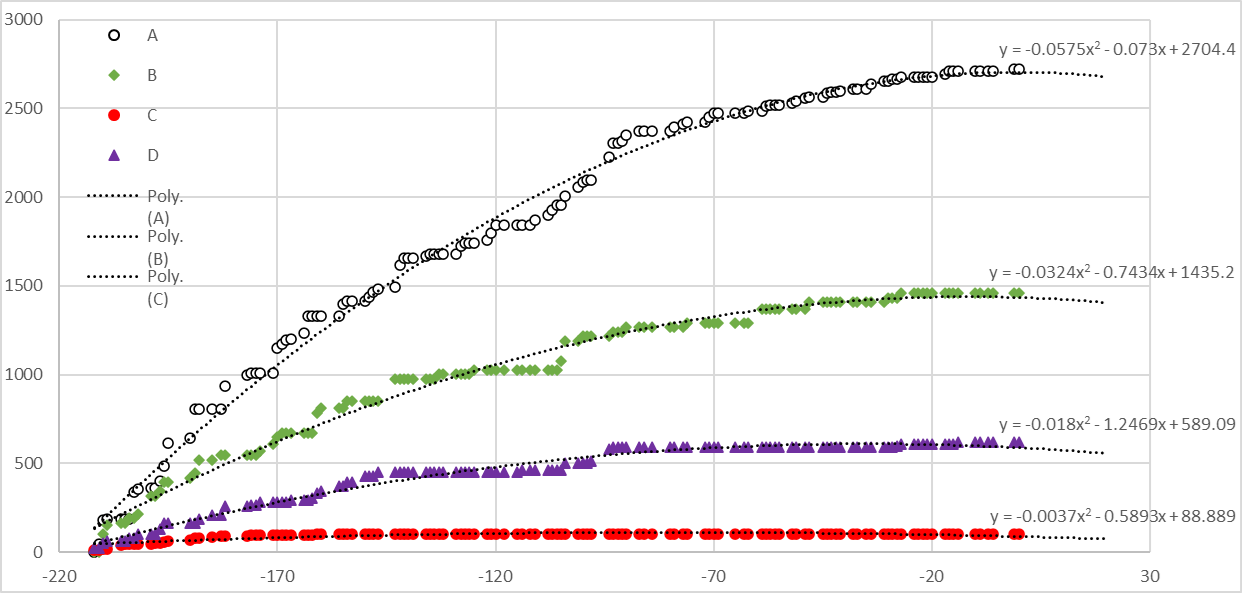
I am trying to derive a set of equations to model a real-world situation: the analysis of expenditure over time, and I am hitting on a number of barriers (all due to my lack of expertise). Once I have a reasonable methodology, I am likely to be using R, and I wish to derive a number of parameters from this data, if at all possible. I also need to validate whether my theoretical model is accurate, or requires further revision.
Objectives
- Determine how much will I have spent in 6 month's time
- Estimate the size of the population (which I can derive from the slope of the curve)
- State the current growth rate or contraction (and project this figure if possible)
I am approaching this task from two sides: (a) can I develop a theoretical model to fit observed data to; and/or (b) do I derive an equation which describes real-world data? This post mainly focusses on the second aspect.
Part of the trigger for this question is that my data is now showing a decrease in expenditure over time (which my theoretical model does not yet account for). If I plot the running total of expenditure over time for four separate services, and then try to fit my curve to it (previously assumed to be quadratic), I get these results:
What these plots show is that over the past 180days, there has been no expenditure at all for the service in red (Line C), and all the other services are also in various stages of termination.
My initial assumption of trying to fit data to a quadratic curve might be in is an error, as demonstrated in the first image. This is because the slope of the line can NEVER be negative. Money only flows "one way". My original model only considered initial growth having new signups at regular intervals, and not any subsequent decline.
Whilst looking at another dataset, I clearly have an asymmetric sigmoid. With this dataset, I only have the final phase (i.e. the data for the initial growth and maintenance phases are missing). In any observed dataset, I've concluded that I will not actually know which section(s) of the sigmoid function to fit to.
Based on the above, is the best approach to try and develop and refine a theoretical model; or to find a model which best describes observational data? Also, how can I fit to a section of a sigmoid function, since I don't actually know which phase my data is likely to cover?
For further background on how I am trying to approach the theoretical modelling, I've posted a separate question at https://math.stackexchange.com/questions/4995809/derivation-of-cost-projection-formula. Crucially, I have not yet made any allowance for the situation which I am seeing in this case, ie. that the rate of expenditure is falling over time.
If necessary, I can post raw data, but there is rather a lot of it.

