8
$\begingroup$

There are two kurtosis types : positive(leptokurtic) and negative(platykurtic). leptokurtic is heavy tailed, and platykurtic is thin tailed. But leptokurtic is more thinner and pointy than platykurtic so I think leptokurtic is thin tailed... But it is heavy-tailed. So I found that I misunderstood the meaning of 'tail'

What does the tail mean?

$\endgroup$
1
  • 1
    $\begingroup$ Can you show an example of what you mean by leptokurtic being thin-tailed (compared to some platykurtic case)? $\endgroup$
    – Glen_b
    Commented Sep 15, 2015 at 0:29

3 Answers 3

16
$\begingroup$

There are two parts to address here -- 1. what does it mean for something to be heavy-tailed? and 2. does higher kurtosis mean a heavier tail and vice-versa?

  1. What's heavy-tailed mean?

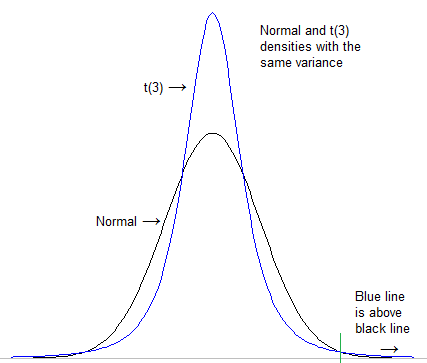
    a. What heavier tail means in a "handwavy" sense -- most people picture it this way:

    enter image description here

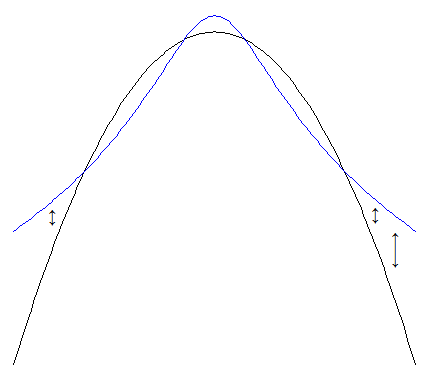
    but because the tail is quite small, it's better to look at the log-density (which preserves the ordering of height of density)

    enter image description here

    (that handwavy sense fails, however, in a variety of cases, including the rather basic situations of when you try to encompass distributions which are not continuous and unimodal)

    b. More strictly, a good definition (about which, see whuber's answer here) for heavy-tailedness would be that if $Y$ is heavier-tailed than $X$, as $t$ becomes sufficiently large, then $S_Y(t)>S_X(t)$ for all $t>t_0$ fr some $t_0$, where $S$ is the survivor function, $1-F$. [This is of course, for heavier-tailed on the right; there'd be a similar definition for left-tail heavy tailedness in terms of $F$ rather than $S$. When both tails are under consideration, as they would need to be for comparing kurtosis, "heavier tailed" would apply if it was heavier in both tails.]

    (Again, however, if you're trying to look at it, a log-scale comparison would often be more useful than a direct comparison of $S(t)$)

  2. How does heavy-tailedness relate to kurtosis?

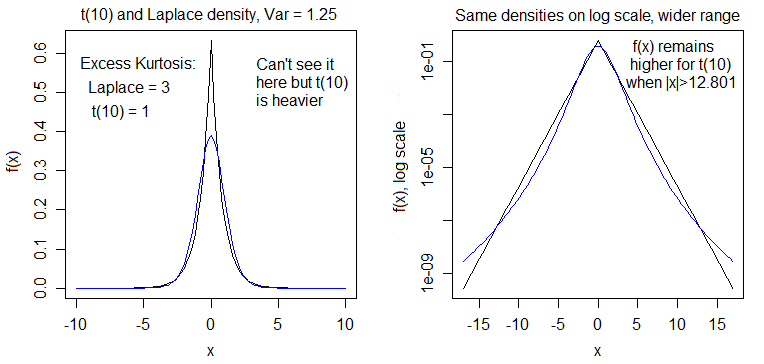
    Now we have a definition of what a heavy tail is, the premise (which is not your own, since it's in countless textbooks) in your question is false -- there is no absolutely general connection between heavy-tailedness and higher 4th standardized moment. It tends to be the case that higher kurtosis goes with heavier tail and vice-versa -- we see that when comparing a t(5) with a normal, for example -- but it's not always the case; one can readily find a lighter-tailed distribution by that definition in 2.b. which nevertheless has higher kurtosis. See this example -- t with 10d.f. vs Laplace:

    ![enter image description here

    (in this case, because $f$ is always higher past a certain point, the survivor function must also be higher at least in that region so we can just stick with density for the comparison. Note that these two densities cross six times. the Laplace has a higher tail between about 2.5145 and 12.8, as well as a higher peak; that gives it higher kurtosis even though its extreme tail is lower)

$\endgroup$
2
  • $\begingroup$ There is not just one measure of tails. E{Z^4*I(|Z| >1)} is one, E{Z^10 *I(|Z| > 5} another. For a sequence of distributions where kurtosis tends to infinity, E{Z^4 *I(|Z| > b)}/kurtosis -> 1, for any b; hence, large kurtosis is mostly determined by the tail. Further, the contribution of |Z| <1 to kurtosis is small, as noted below, for all distributions. Hence, kurtosis itself is a measure of tailweight, although not identical to other tailweight measures. Similarly, other tailweight measures do not measure the same thing as kurtosis. There are, after all, infinitely many tailweight measures. $\endgroup$ Commented Nov 9, 2017 at 13:19
  • 2
    $\begingroup$ Also, the given "definition" of heavier-tailed is actually quite silly. By that definition, the N(0,1) distribution is heavier-tailed than the .9999*U(-1,1) + .0001*U(-1000,1000) distribution. The latter distribution is extremely outlier-prone and has very high kurtosis, the former is not outlier-prone at all and has low kurtosis. The argument is a complete red herring, because it is not even a logical measure of "tailedness". $\endgroup$ Commented Nov 20, 2017 at 0:27
3
$\begingroup$

Comments from probably deleted duplicate question that are useful:

In fact, higher kurtosis is associated with both increased peakedness and heavier extreme tails, but there's no necessary relationship in either case (you can find counterexamples to higher peak or heavier extreme tails, even though both are typical with higher kurtosis). A variety of shapes is possible in either case. – Glen_b♦ Sep 17 '13 at 11:10

Kendall and Stuart (I think in Vol I) present a collection of counterexamples to the various combinations of peak and tails. See also the discussion here – Glen_b♦ Sep 17 '13 at 11:16

Also see the paper by Kevin P. Balanda and H.L. MacGillivray. "Kurtosis: A Critical Review". The American Statistician 42:2 [May 1988], pp 111–119. (And yes, generally speaking, fat-tailed and heavy-tailed are synonyms, except for contexts where one or both has been given an explicit definition.) – Glen_b♦ Sep 17 '13 at 11:23

You might want to read the following paper: DeCarlo, L. T. (1997). On the meaning and use of kurtosis. Psychological Methods, 2(3), 292. – Alecos Papadopoulos Sep 17 '13 at 23:31

A caveat about the DeCarlo paper - the very first sentence of the abstract is wrong! Even for symmetric, unimodal distributions, high kurtosis does not mean "peakedness," and low kurtosis does not mean flatness. There are symmetric, unimodal flat-topped distributions with extremely high (even infinite) kurtosis; there are also infinitely peaked distributions with negative excess kurtosis. See specific examples given here: en.wikipedia.org/wiki/… – Peter Westfall Oct 21 '17 at 12:20

Glen_b, your "you can find counterexamples to heavier extreme tails, though both are typical with higher kurtosis" is only correct if you define "heavier extreme tails" in a particular way out of infinite ways. There is no counterexample to the mathematical facts that (i) as kurtosis tends to infinity, E(Z^4*I(|Z| >b))/kurtosis ->1, for all b; and (ii) kurtosis is within +- .5 of E(Z^4*I(|Z| > 1)) +.5; both of these statements explain how kurtosis is related to tails of the distribution, and not the peak. If you define "heavier tails" as larger "E(Z^4*I(|Z| > 1))" then there you have kurtosis. – Peter Westfall Nov 15 '17 at 23:32

Glen_b, your comment "In fact, higher kurtosis is associated with both increased peakedness ..." seems patently false in the face of numerous counterexamples. Can you provide a theorem to justify it? – Peter Westfall Nov 20 '17 at 1:43

The above, and the question itself are rooted in what kurtosis is. It may be useful to review a physical problem for which kurtosis is defined. For that, the fourth moment about the mean is analogous to a thin sheet of material rotated about its mean mass, or vertical balance point, as a rate of change of a rate of change of torque. This says very little about the thin sheet's height at any particular distance from the axis of rotation, but rather is an integral behaviour over the whole sheet.

$\endgroup$
9
  • 1
    $\begingroup$ Very helpful collection of notes (+1). Often overlooked is Kaplansky, I. 1945. A common error concerning kurtosis. Journal, American Statistical Association 40: 259 only. This gave concrete examples showing that higher and lower kurtosis (in the specific sense of dimensionless ratio based on fourth and second moments around the mean) can contradict any word summary based on peaks or tails. If the name seems familiar somehow, Irving Kaplansky is better known as an outstanding algebraist (groups, rings, and what not). $\endgroup$
    – Nick Cox
    Commented Oct 20, 2018 at 9:54
  • $\begingroup$ Nick, this is not a correct characterization of Kaplansky's paper as regards tails. He mentions peak only, and nothing about tails. Specifically, he showed that, among distributions having mean=0 and variance=1, larger kurtosis does not correspond to a higher peak. As you know, I gave three theorems in my 2014 TAS paper relating kurtosis to a distribution's tails, and I mention a fourth such theorem in my post above. So indeed, kurtosis measures tails. $\endgroup$ Commented Oct 25, 2018 at 18:46
  • $\begingroup$ @PeterWestfall The greater the moment, the greater the tail bias from the integral definition of the $n^{\text{th}}$ moment; $\int (x-\mu)^n f(x) dx$, provided that the range of $|x-\mu|>1$. When the range of $|x-\mu|<1$, the opposite should be true. $\endgroup$
    – Carl
    Commented Oct 26, 2018 at 22:46
  • $\begingroup$ Hi Carl. State as a theorem (or conjecture) please? In particular, "tail bias" does not seem to be defined. You might check my various theorems and counterexamples first though. $\endgroup$ Commented Oct 27, 2018 at 13:07
  • $\begingroup$ @PeterWestfall Please provide a link to you paper. I used the word bias improperly for stats, I get it from more from EE, apologies. In the region for which $|x-\mu|>1$ then $|(x-\mu)^{n+1})|>|(x-\mu)^n|$, i.e., the weighting of the tail is relatively heavier. This outlines a tendency for tail influence. To see if this influence dominates $f(x)$ behaviour for $n$ depends on all of $f(x)$, not just $|x-\mu|>1$. $\endgroup$
    – Carl
    Commented Oct 27, 2018 at 19:59
2
$\begingroup$

There is most definitely a direct relationship connection between kurtosis and the tails of distribution. One simple connection is as follows: Let $X$ be any random variable with finite fourth moment, let $Z = (X - \mu)/\sigma$, and let $U = Z^4$. Then the kurtosis of $X$ is $E(U)$.

A common way of teaching and understanding expectation is using the "point of balance" concept, where the expected value of a random variable is equal to the point on the horizontal axis where the distribution plot balances.

Consider the plot of the probability distribution function (pdf) of $U$, and locate the value 3.0 on the horizontal axis. This is the kurtosis of the normal distribution. If the pdf is too heavy to the right of 3.0, so that it is pulled down to the right when attempted to balance at 3.0, then the kurtosis is greater than 3.0, and the distribution of $X$ can be said to be "heavier tailed than the normal distribution." Conversely, if the pdf of $U$ is too light to the right of 3.0, so that the curve is pulled down to the left when attempted to balance at 3.0, then the kurtosis is less than 3.0, and the distribution of $X$ can be said to be "lighter tailed than the normal distribution."

In light of the above discussion, "tail leverage" is perhaps a better characterization of kurtosis than "tail mass." It is possible that more mass in the tails corresponds to less kurtosis, and that less mass in the tails corresponds to greater kurtosis. It all depends on the remoteness of the mass; i.e., it depends on the leverage.

Precise mathematical logic showing that kurtosis is mostly determined by the tails is given as follows:

For all possible distributions of random variables $X$ having finite fourth moment (discrete, continuous, skewed, empirical), kurtosis is necessarily between

$\int Z^4 I(|Z| > 1) dF(Z)$

and

$\int Z^4 I(|Z| > 1) dF(Z) + 1$,

where $Z = (X-\mu)/\sigma$.

For continuous distributions in this class with density of $Z^2$ decreasing on the interval $[0,1]$, the "$+1$" is reduced to "$+.5$" or less.

Finally, for any sequence of distributions where the kurtosis $k$ tends to infinity,

$\int Z^4 I(|Z| > b) dF(Z) / k \rightarrow 1$,

for all real $b$.

These are all mathematical theorems so there can be no counterexamples.

Thus, it is primarily the values in the tails of the $Z$ distribution that determine the value of kurtosis.

Yes, there are other tailweight measures that are not kurtosis, in fact there are infinitely many. So it is a red herring to state that kurtosis does not measure tailweight if it does not correspond to a particular tailweight measure. It is an unsupported generalization to say that, just because kurtosis does not measure one of infinitely many tailweight measures, that kurtosis itself does not measure tailweight.

I have seen no theorems generally linking kurtosis to the peak, or to the probability concentration within the $\mu \pm \sigma$ range, but I have seen plenty of counterexamples to such notions. Can anyone point to such a theorem?

The three theorems I mentioned above are proven in Westfall, P.H. (2014). Kurtosis as Peakedness, 1905 – 2014. R.I.P. The American Statistician, 68, 191–195. https://www.ncbi.nlm.nih.gov/pmc/articles/PMC4321753/

Edit, 7/18/2018: Yet another theorem to connect kurtosis to the tails (and not the peak). Take any distribution (or data set). Remove the data or mass within one standard deviation of the mean. Replace the data/mass in any way you like, but keep the mean and standard deviation the same as with the original data/distribution. Then the difference between the maximum and minimum kurtosis for all such replacements is $\le$ 0.25.

If you play the same game with the tails, the difference is unbounded.

$\endgroup$
1
  • $\begingroup$ Another direct connection of kurtosis to tail is this: Consider the (discrete or continuous) distribution of $V = Z^4$, say $p(v)$. (Here, $Z = (X-\mu)/\sigma$, where $X$ is the original data or random variable.) The function $p(v)$ balances precisely at the kurtosis of the distribution of $X$. Place a fulcrum at 3.0 under the graph of $p(v)$; 3.0 is the kurtosis of the normal distribution. If the graph of $p(v)$ falls to the right of the fulcrum at 3.0, then the pdf of $X$ is heavier-tailed than the normal distribution. If it falls to the left, then it is lighter-tailed. $\endgroup$ Commented Aug 8, 2019 at 13:54

Your Answer

By clicking “Post Your Answer”, you agree to our terms of service and acknowledge you have read our privacy policy.

Not the answer you're looking for? Browse other questions tagged or ask your own question.