5
$\begingroup$

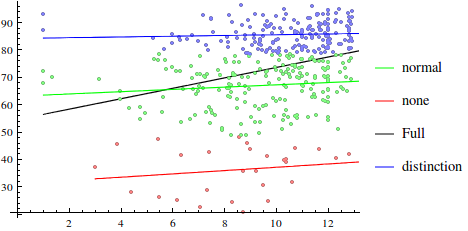
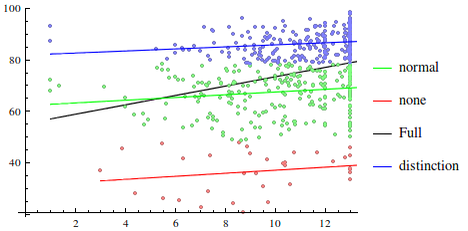
OK, so I have data from a class that had a preparatory self-test to see how prepared they were for the class, and the final results for the class. The preparatory self-test had a range from 0..13 and the final had a range from 0..100.

(don't mind the normal, none, distinction legend, that's just the class (Coursera) had a threshold for certificates at 50%, and you'd get a "with distinction" above 80%)

But, here, look at these two graphs:
Before culling the 13s
(source: hex21.com)

After culling the 13s
(source: hex21.com)

The correlation coefficient for the full data set is r=0.29782 and if I remove the 13s from the preparatory self-test becomes r=0.294383, so I guess the correlation doesn't change all that much.

But, I guess my question was more sort of, is it valid/a good idea to remove the 13's from the preparatory test?

Here's what I was thinking: The final seems to be valid for the set of students being tested. But, you really can't distinguish between one student who got a 13 and another who got a 13, because they "maxed" out the test. (Like if you had a scale that measured up to 100 grams, and you put an elephant, a whale and a chicken on it, and declared them all to be "100 grams")

What should one do if the test is being maxed out by certain people? Is it better to leave it in, to remove it, or to do something else altogether with it?

Thanks!

$\endgroup$
8
  • 1
    $\begingroup$ You can treat the 13s as censored results, adopting the view that they represent an interval from 13 on up achieved on some hypothetical test where the scores could go higher. (800s on the SAT work this way: it is scored internally to a higher range and censored at 800.) That suggests you use methods of censored regression. These methods include techniques of survival analysis. That gives you a very large set of practicable approaches you can research here. $\endgroup$
    – whuber
    Commented Dec 20, 2013 at 17:05
  • 2
    $\begingroup$ One can't help noticing the high-leverage outliers at the left. They contribute disproportionately to lowering the correlation coefficients. Such ridiculously low scores likely represent people who blatantly blew off the test. Because these scores can be recognized as anomalous in advance, if you intend to use these results for prediction, it would be valid to throw such scores out. $\endgroup$
    – whuber
    Commented Dec 20, 2013 at 17:08
  • $\begingroup$ @whuber I don't think a survival analysis would be appropriate here. Censoring is best used for time-to-event data modeling a binary outcome when the subject does not experience the outcome by a certain point, but no longer remains under observation. $\endgroup$
    – AdamO
    Commented Dec 20, 2013 at 17:16
  • $\begingroup$ @AdamO You might want to take that up with Dennis Helsel who advocates the survival analysis approach. Anyway, I don't follow your argument: one could plausibly view a test score as analogous to survival time and a "perfect" score as "survival" past a fixed threshold. The data will determine whether or not standard survival models apply to them. $\endgroup$
    – whuber
    Commented Dec 20, 2013 at 18:22
  • 1
    $\begingroup$ @AdamO This is not a truncated dataset, that's why. Removing the perfect scores would truncate it; including them censors it. $\endgroup$
    – whuber
    Commented Dec 20, 2013 at 18:59

2 Answers 2

2
$\begingroup$

The answer to this problem is using a direct maximum likelihood approach. This involves application of the EM algorithm. This is somewhat involved for the applied analyst, but a statistician should be greatly familiar with these methods. With this, you assume subjects who receive a "perfect score" could have received better scores had your test been sufficiently calibrated to do so.

Assuming the relationship between preparatory test and final exam performances is estimated with least squares, then we know that the parameter estimates are maximum likelihood estimates from a bivariate normal relationship. We then write the likelihood in a similar format but, for individuals scoring perfect scores, replace their likelihood contribution (normally a PDF) with a complimentary CDF. That way, you iteratively estimate the bivariate means, and the 2 by 2 covariance matrix for truncated normal data according to the observed data using the EM algorithm.

This type of analysis is done all the time with truncated normal lab data, such as CD4 counts in AIDS patients. There is plenty of literature out there on the EM Algorithm, but the originating paper due to Dempster is well written and intuitive.

$\endgroup$
2
$\begingroup$

I would recommend leaving them in. The people who were "fully prepared" are important to your analysis because you want to see how they did on the final as well. Sure, you cannot distinguish the 13's from one another in terms of preparedness, but you can see they are more prepared than the students who scored less on the preparatory self-test. Like you said, the 13's might be better interpreted as 13+'s. But you certainly would not want to remove that many samples from your analysis because their information is still important to the conclusions you wish to make. If possible in the future, I would recommend making the preparatory self-test more difficult so that you can get finer resolution of the students' preparedness at the higher end of the scale.

$\endgroup$

Your Answer

By clicking “Post Your Answer”, you agree to our terms of service and acknowledge you have read our privacy policy.

Not the answer you're looking for? Browse other questions tagged or ask your own question.