I have data coming from a sensor that I store in a time serie.
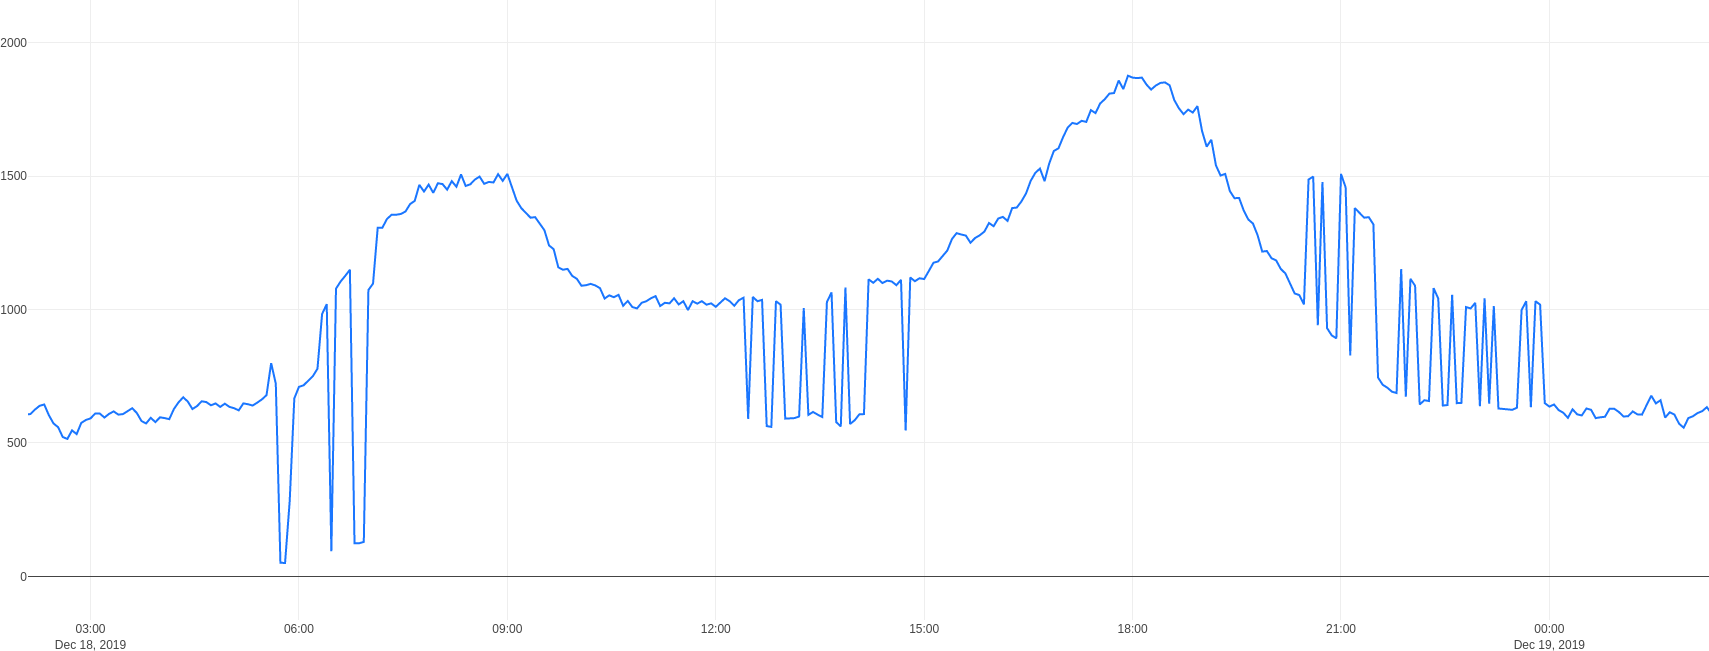
When I graph them, I obtain:
These data are supposed to be "continuous", like temperatures, not going up and down so fast.
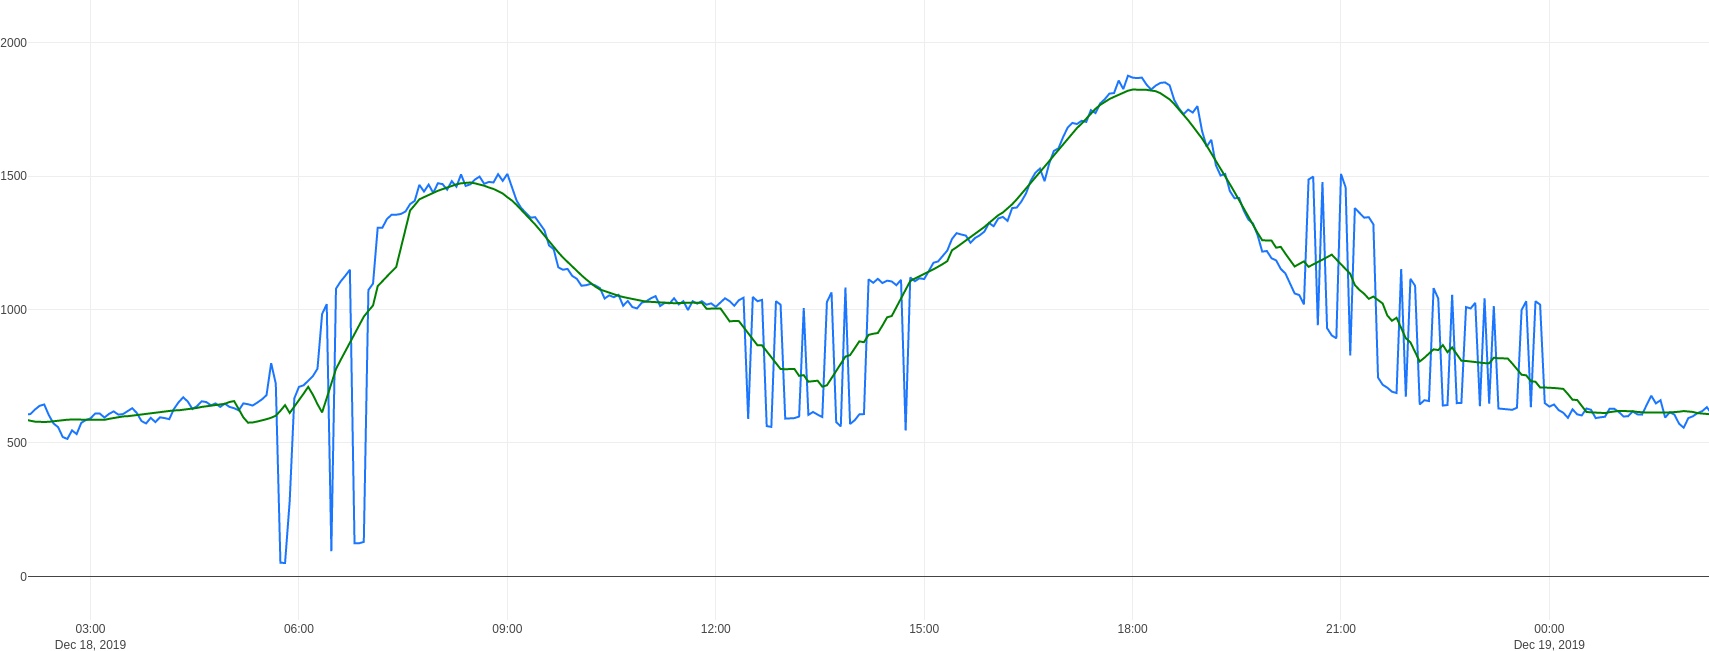
After searching similar issues on the web - I think "smoothen curve" have given me the more relevant results - I apply "convolution" to data, using code provided in this answer.
I obtain:
It is not satisfying as I guess that some data points are just "wrong" and should be removed, not averaged.
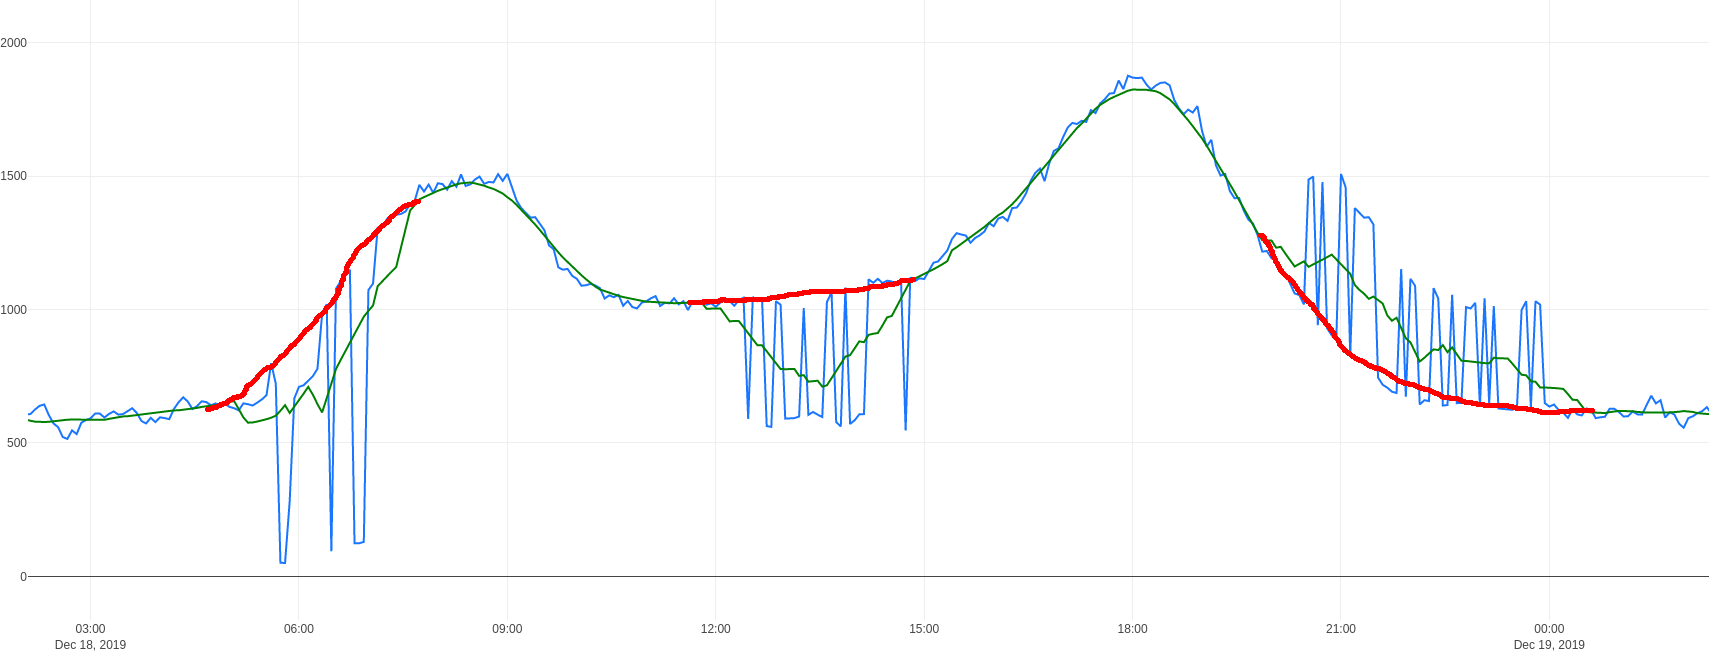
Doing it by hand is quite easy as we can guess the curve:
Here are the data and code to produce the second chart:
def smooth(y, box_pts):
    import numpy as np
    box = np.ones(box_pts)/box_pts
    return np.convolve(y, box, mode='same')


def load_data(f):
    from datetime import datetime as dt
    with open(f, "rt") as fd:
        X = []
        Y = []
        for line in fd.readlines():
            (x,y)=line.strip().split(" ")
            X.append(dt.fromtimestamp(int(x)))
            Y.append(float(y))
        return (X, Y)


import sys
(X,Y) = load_data(sys.argv[1])

from matplotlib.pyplot import plot, show
plot(X, Y,'b-')
plot(X, smooth(Y,19), 'g-', lw=2)
show()
I'm looking for an algorithm that would remove "bad" values, any idea ?


