1
$\begingroup$

I have data coming from a sensor that I store in a time serie.

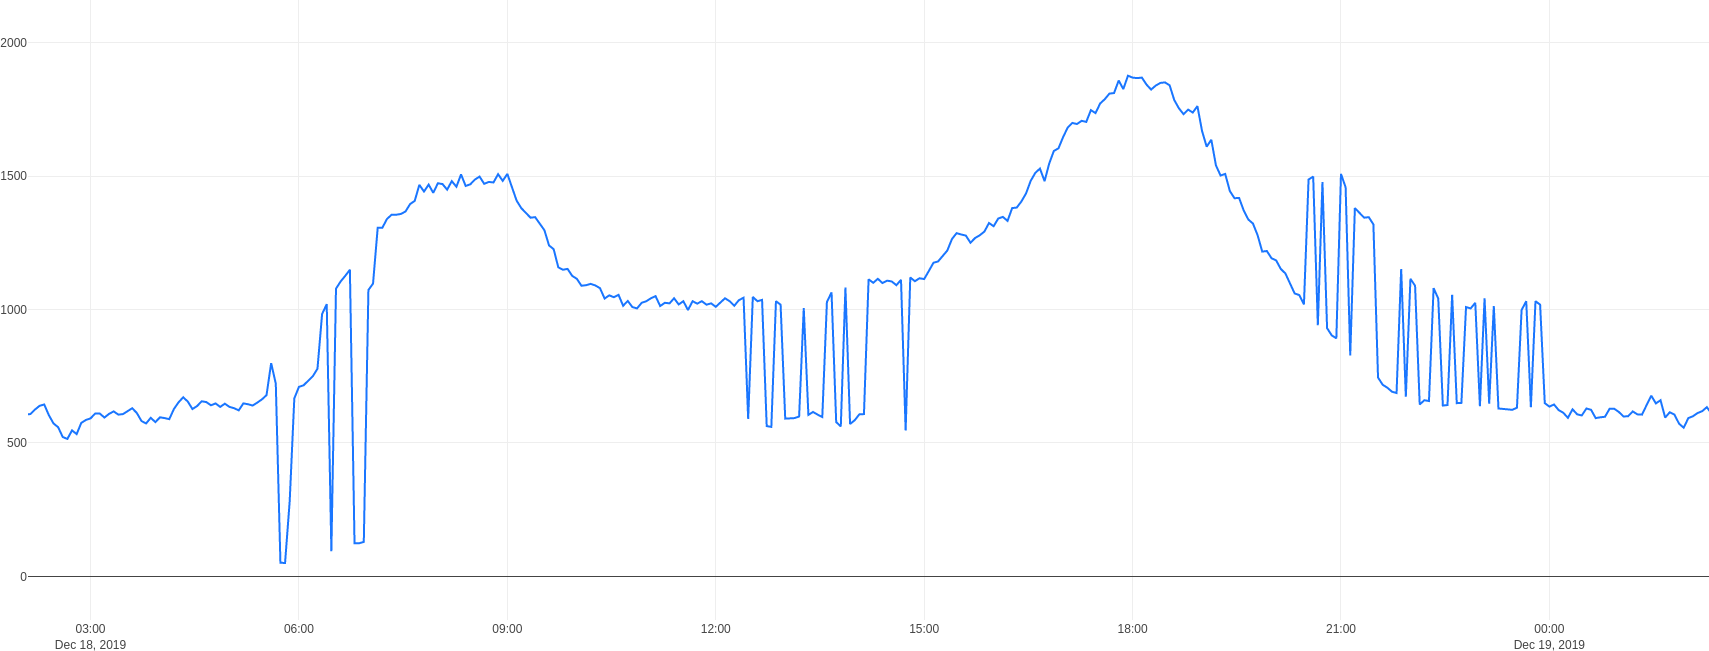
When I graph them, I obtain:

raw data chart

These data are supposed to be "continuous", like temperatures, not going up and down so fast.

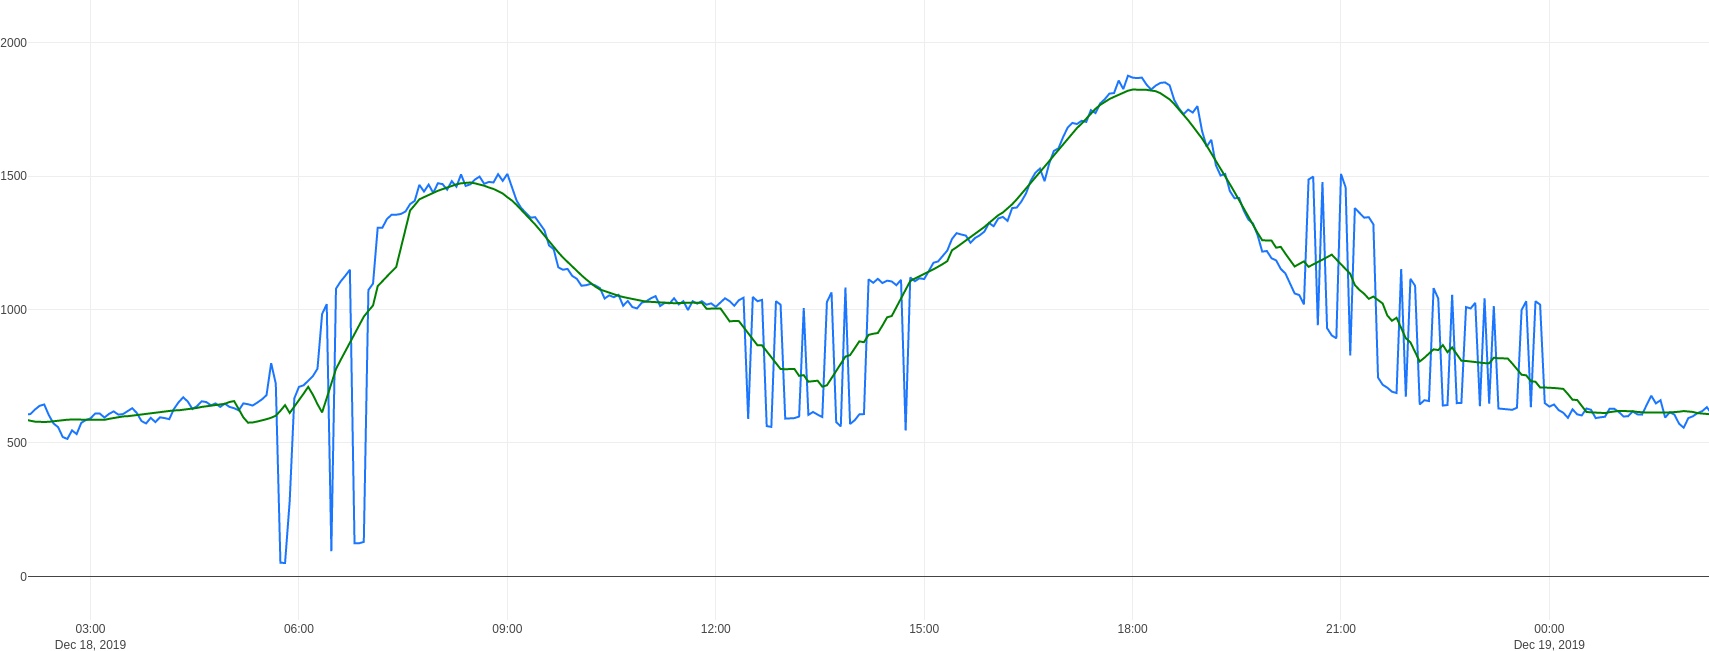
After searching similar issues on the web - I think "smoothen curve" have given me the more relevant results - I apply "convolution" to data, using code provided in this answer.

I obtain:

with convolution chart

It is not satisfying as I guess that some data points are just "wrong" and should be removed, not averaged.

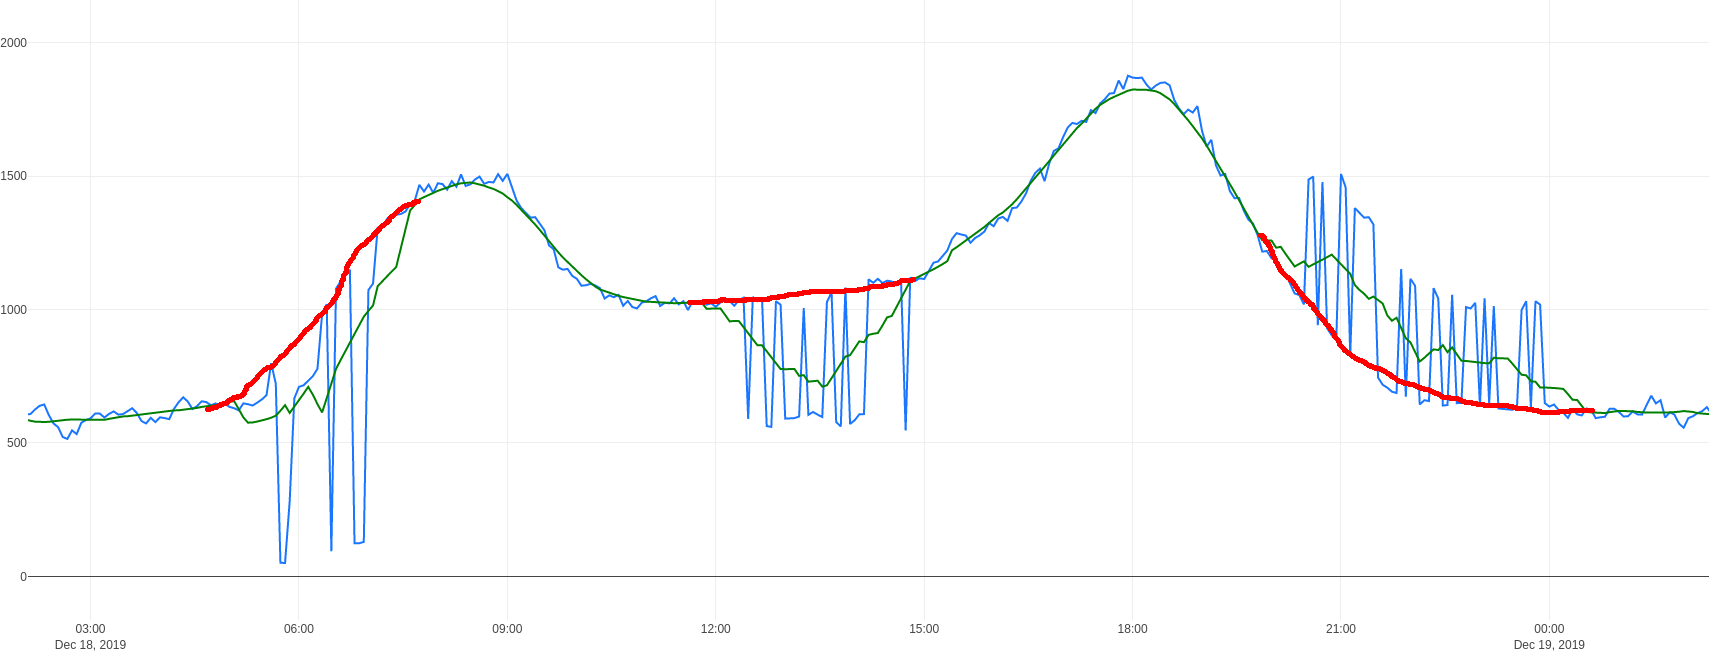
Doing it by hand is quite easy as we can guess the curve:

by hand fixed chart

Here are the data and code to produce the second chart:

def smooth(y, box_pts):
    import numpy as np
    box = np.ones(box_pts)/box_pts
    return np.convolve(y, box, mode='same')


def load_data(f):
    from datetime import datetime as dt
    with open(f, "rt") as fd:
        X = []
        Y = []
        for line in fd.readlines():
            (x,y)=line.strip().split(" ")
            X.append(dt.fromtimestamp(int(x)))
            Y.append(float(y))
        return (X, Y)


import sys
(X,Y) = load_data(sys.argv[1])

from matplotlib.pyplot import plot, show
plot(X, Y,'b-')
plot(X, smooth(Y,19), 'g-', lw=2)
show()

I'm looking for an algorithm that would remove "bad" values, any idea ?

$\endgroup$
6
  • $\begingroup$ Have you tried MA smoothing? $\endgroup$ Commented Dec 23, 2019 at 12:04
  • $\begingroup$ @user2974951, I don't know what is MA. $\endgroup$
    – Setop
    Commented Dec 23, 2019 at 12:13
  • $\begingroup$ Moving Average, in the context of time series analysis. $\endgroup$ Commented Dec 23, 2019 at 12:15
  • $\begingroup$ If you don't want to average the "wrong" observations, you could try removing the culprits, and then using spline interpolation. $\endgroup$ Commented Dec 23, 2019 at 12:44
  • $\begingroup$ @user2974951, yes, I want to remove the culprits. The point is how to detect them automatically. $\endgroup$
    – Setop
    Commented Dec 23, 2019 at 15:29

1 Answer 1

0
$\begingroup$

Welcome to CrossValidated!

I would perhaps go iteratively from the beginning to the end, setting all data points to missing where the absolute or relative difference to the last non-missing data point is large. It seems in your dataset, the wrong sensor data is easily discernible by the large jump compared to what you would expect (perhaps allow for increasing differences the further away you move from the last non-missing data point). By setting them iteratively to missing, you will be also able to discern adjacent wrong data point. In a second step you can then interpolate the missing points again iteratively via splines or moving averages.

You can also try some robust regression approaches such as quantile regression (with a flexible trend component).

$\endgroup$
2
  • $\begingroup$ Thanks Arne, i'll try your way. About second way, what is quantile regression ? $\endgroup$
    – Setop
    Commented Dec 23, 2019 at 22:13
  • $\begingroup$ Quantile regression estimates conditional quantiles (such as the median) rather than the conditional mean as it is the case for OLS. This has the advantage that quantile regression used to be more robust to outliers in the independent variables. This is why it can be used for outlier detection. Specifying the trend is however not trivial. $\endgroup$ Commented Dec 24, 2019 at 8:19

Your Answer

By clicking “Post Your Answer”, you agree to our terms of service and acknowledge you have read our privacy policy.

Not the answer you're looking for? Browse other questions tagged or ask your own question.