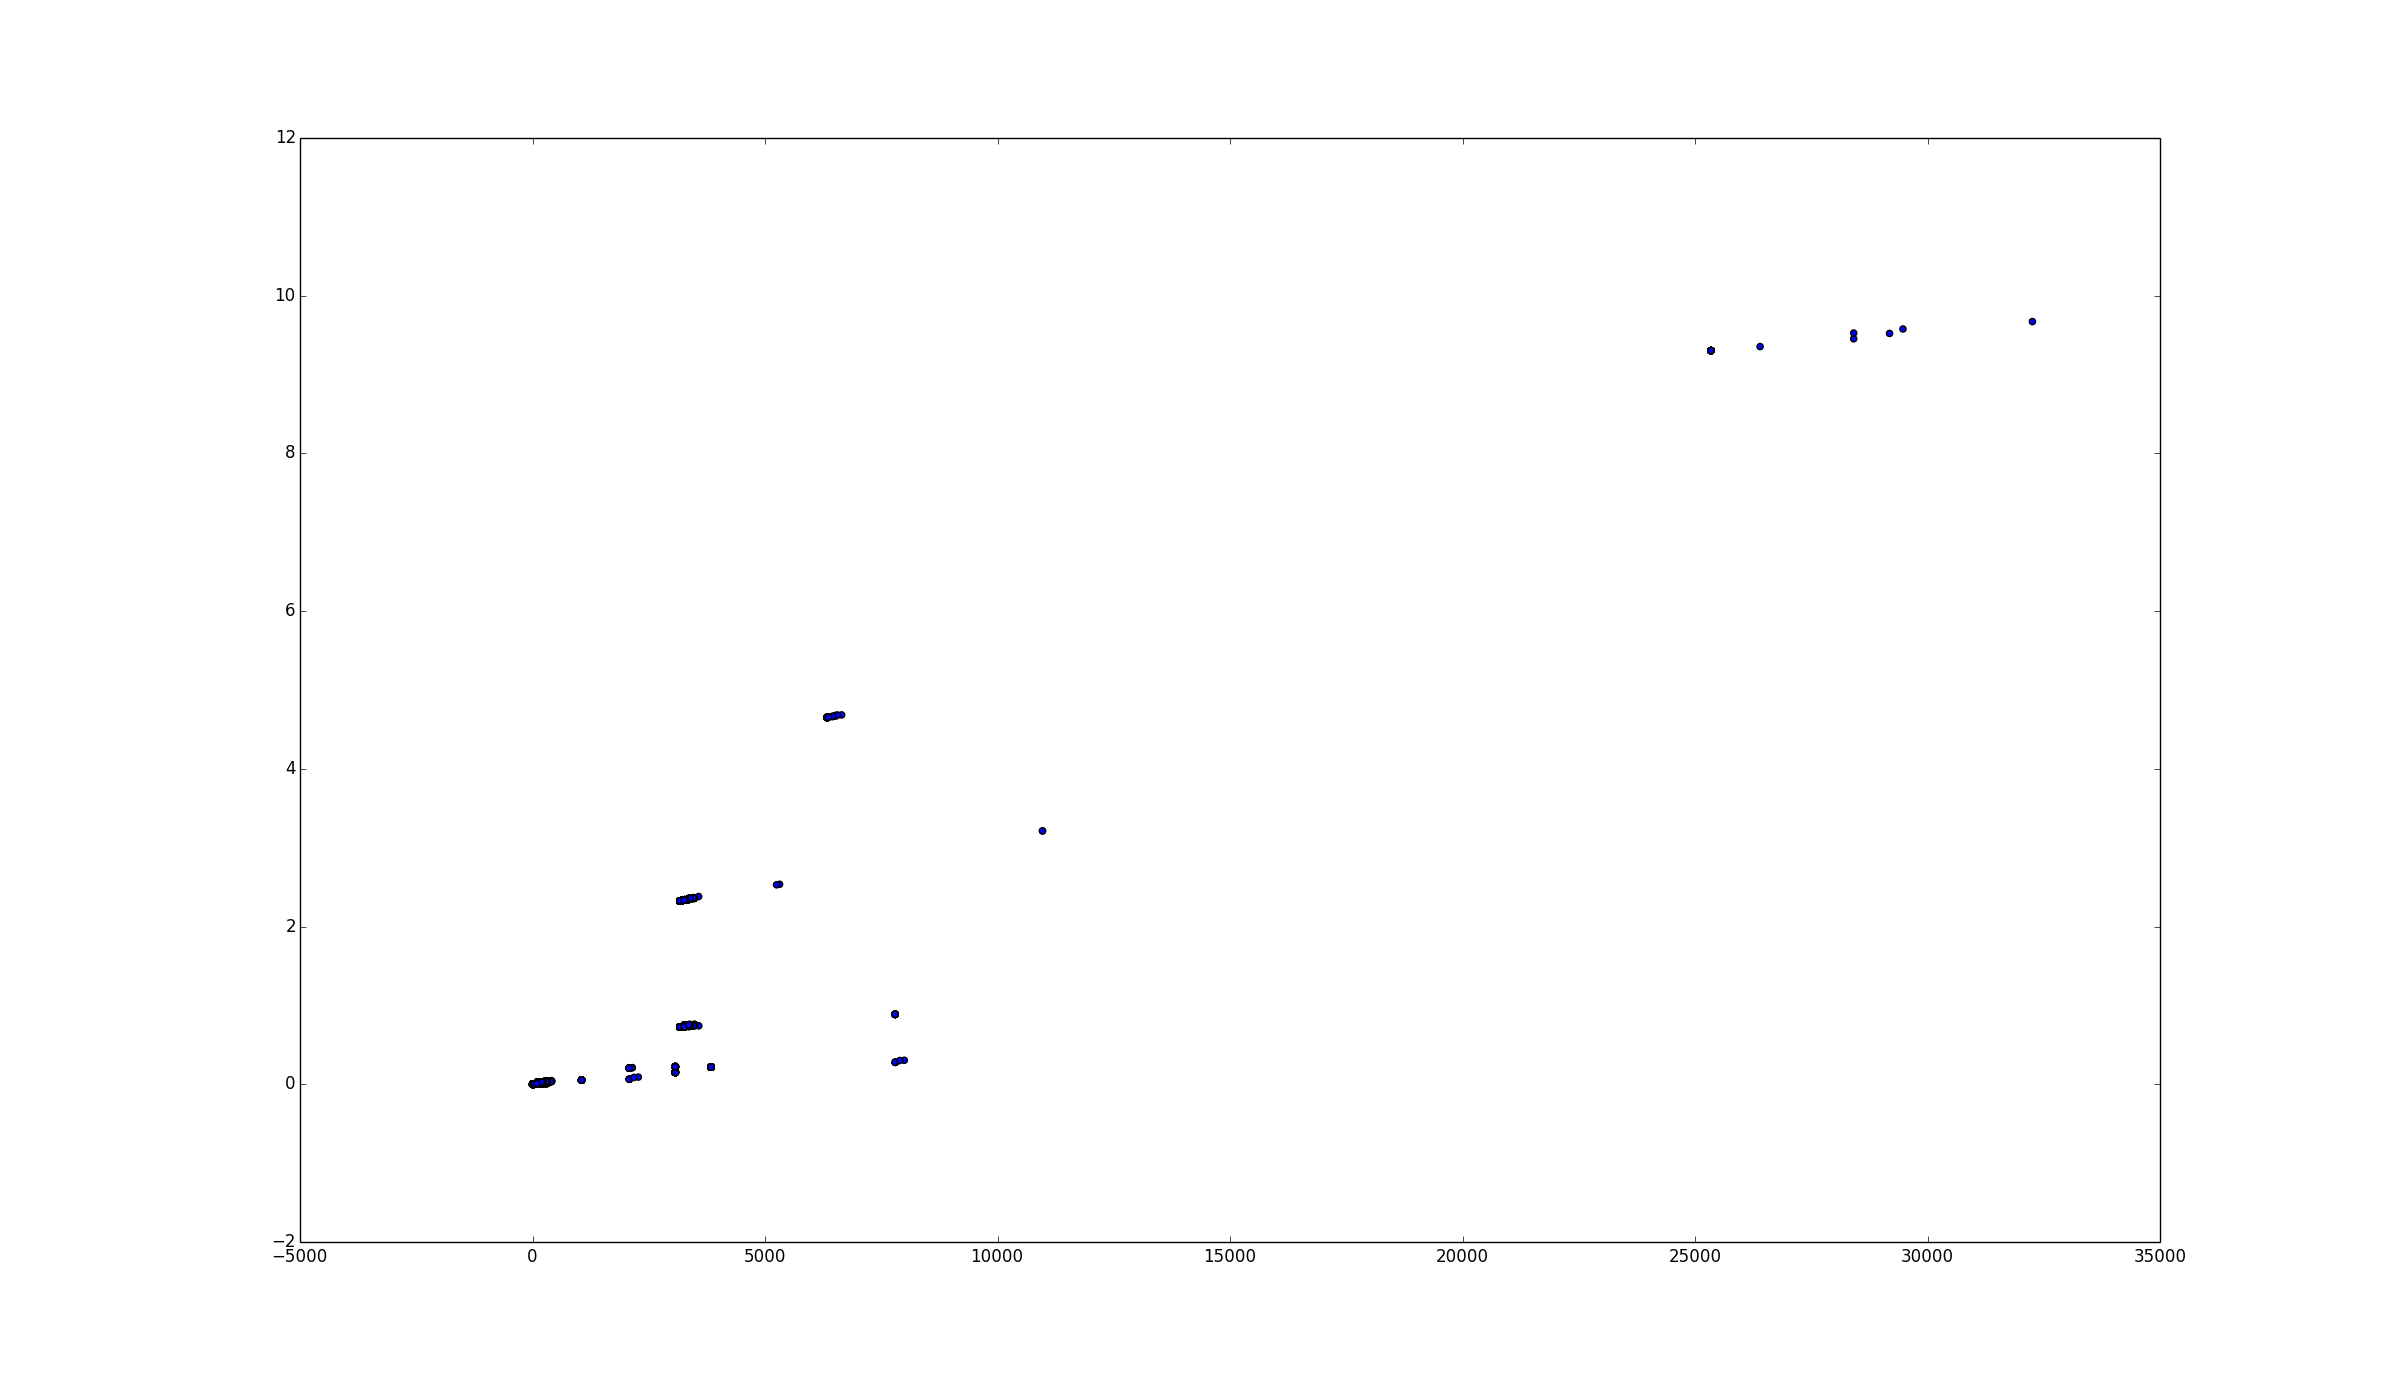
I have a data set where there are two variables X and Y, X being a set of values and Y being a set of corresponding values, like X = [1, 2, 3, 4] and Y = [100, 200, 300, 400].
Ideally I should have a directly proportional relationship. When X increases Y does too, and vice versa. What I would like to do is learn what might be the relationship, is it linear or non-linear or something else. How are such things explored?
More generic question when give two such variables how do you start exploring it?
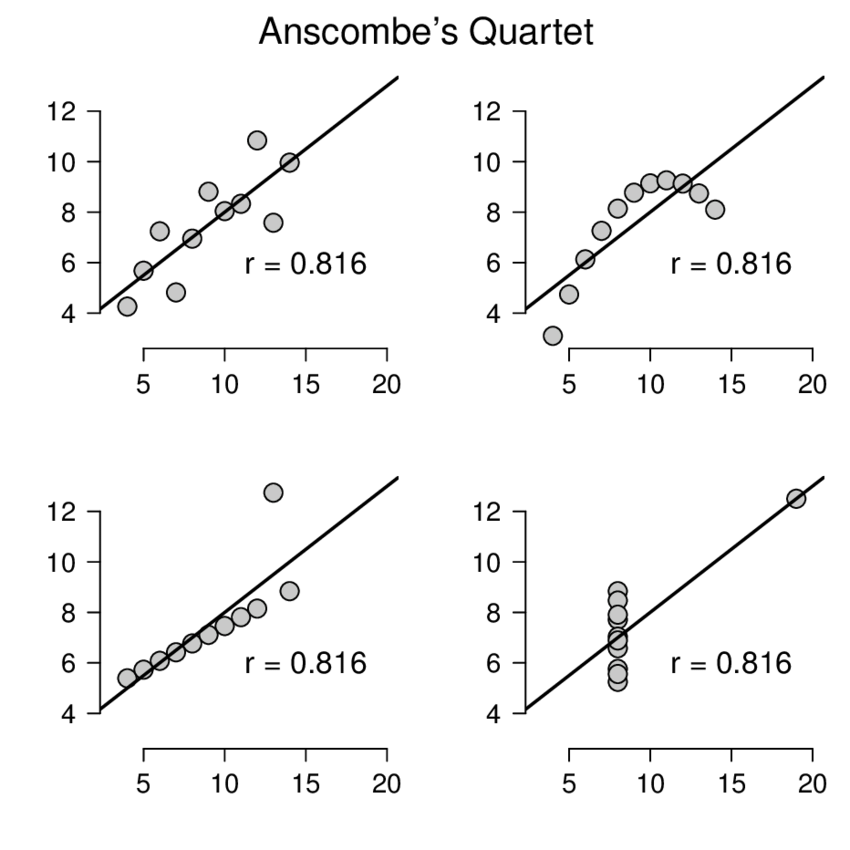
How to check if there is correlation?
Attaching the scatter plot image 

