2
$\begingroup$

I have imputed a dataset which has 20 observations. Participants were asked to rate the importance of 13 variables under a certain circumstance, from 0 to 25.

I imputed this using mice(imp=25, max_it=25), and got a nice dataset after a few hours. I'm now analysing it using boxplots per circumstance (thus 13 boxplots at a time), but wonder how I can measure the significance per circumstance of boxplots. Groups of boxplots
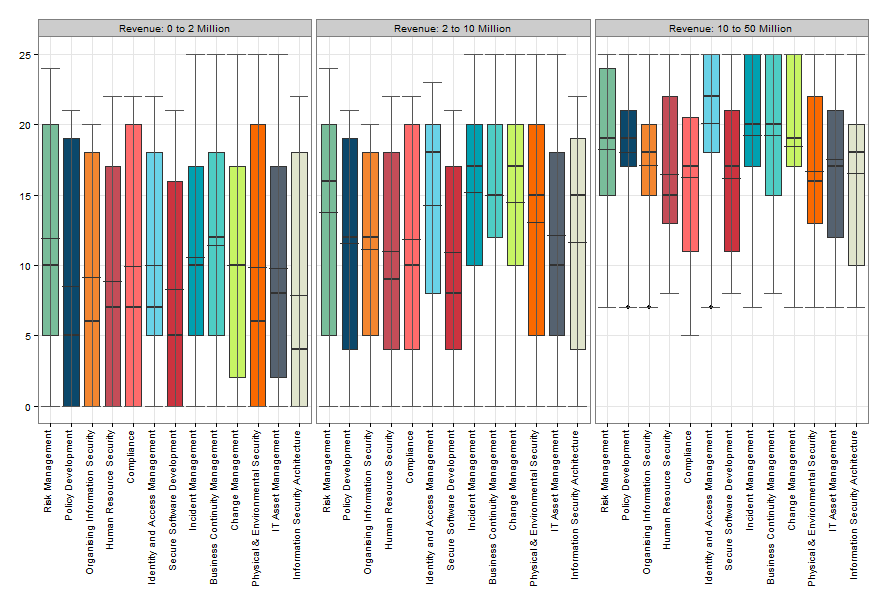
In the above example it is clear that the circumstance Revenue: 0 to 2 Million is different from the Revenue: 10 to 50 Million and possibly from 2 to 10 Million but how can I measure this statistically?

My data has a normal distribution. A friend recommended ANOVA, but that's univariate and I feel that 20 observations is too little...

I saw: How to compare two groups on a measure of social skills that includes 5 subscales where each subscale is number correct out of 12? but not really sure if that applies since its non-parametric.

$\endgroup$
6
  • $\begingroup$ If the scale of the responses runs from 0 to 25 then the suggestion that your data has a normal distribution will be false. Where the data runs up against each bound the discrepancy from normality might become severe. $\endgroup$ Commented Feb 1, 2014 at 21:09
  • 1
    $\begingroup$ I think that you should explore some different data visualisation approaches before worrying about hypothesis testing. Perhaps a dithered dot plot would make the data easier to see. $\endgroup$ Commented Feb 1, 2014 at 21:10
  • $\begingroup$ I disagree, the boxplots clearly show min, max, median, mean, and more or less the distribution. Enough data for understanding what the 20 participants entered and agreed upon $\endgroup$ Commented Feb 2, 2014 at 1:06
  • $\begingroup$ perhaps a correlation would work? $\endgroup$ Commented Feb 6, 2014 at 9:57
  • $\begingroup$ How did you test whther your data is normally distributed? When I look at your plot, I wouldn't be surprised that some of your variables are not normally distributed. $\endgroup$
    – Jaap
    Commented Feb 7, 2014 at 8:34

2 Answers 2

1
+50
$\begingroup$

If I understand you correctly, you asked 20 participants to give a score for 13 variables in 3 different conditions. Which means you have a within subjects design. I suggest the following steps:

1) Test for normality. You can do this both visually and statistically. Visually: make a barplot/histogram for each variable in each condition. This will give you 39 plots (or 13 faceted plots for each variable). Statistically: do a Shapiro test for each variable in each condition. You should do both in my opinion.

2) Statistical testing for differences. The type of test you use depends on the normality of your data. If everything is normally distributed, you can use a repeated measures ANOVA (you can do this with the ez package in R). As a post-hoc test you can use pairwise t-tests.

When your data is not normally distributed, you can use a robust repeated measures ANOVA. You'll need the WRS package for that.


When you want to reduce the impact of outliers, you have several options:

  1. Remove the outliers. Not preferred. Only when you have reason to believe that the case does not belong to the intended population.
  2. Transform the data. As outliers tend to skew the distribution, a transformation can reduce this influence. The most common types of transformations are: log, square-root & reciprocal (1/x).
  3. Replacing the value. Only use when transformation fails. There are several options: (a) next highest(lowest) score plus(minus) one, (b) converting back from a z-score, (c) mean plus standard deviation.

Source: Discovering statistics with R (Andy Field)

$\endgroup$
10
  • $\begingroup$ Tested for normality, using Wilk-Shapiro test, and all vars are Normal distributed. Can I do an ANOVA over 20 observation? Isn't that too little? Also, looking at the broad sistribution, is the mean too much pushed around due to outliers at 20 observations? $\endgroup$ Commented Feb 7, 2014 at 10:38
  • $\begingroup$ For a normal ANOVA, 20 participants is not enough. For a repeated measures ANOVA with three repeated measures, 20 participant is acceptable (actually you have 20*3=60 observations). However, working with e.g. 30 participants will increase the reliability. $\endgroup$
    – Jaap
    Commented Feb 7, 2014 at 12:40
  • $\begingroup$ Do you have many outliers? $\endgroup$
    – Jaap
    Commented Feb 7, 2014 at 12:41
  • $\begingroup$ in general not, 0-2 per condition (thus 13 vars). Some conditions have up to 20. In the image above, there are 3 outliers (little dots in the 3rd condition) $\endgroup$ Commented Feb 7, 2014 at 13:01
  • $\begingroup$ As the outliers occur in seperate variables with only one per variable (in the image), the mean is probably not affected to much. In a condition with 20 outliers, it depends on how they are distributed. Are they concentrated in specific variables? If so, are these varables still normally distributed? $\endgroup$
    – Jaap
    Commented Feb 7, 2014 at 13:37
0
$\begingroup$

Does a Kruskal-Wallis one-way analysis of variance test work? It is non-parametric and uses ranking to test significance in differences between samples. It is the non-parametric equivalent to ANOVA. It might not work on all of the variables at once?

http://udel.edu/~mcdonald/statkruskalwallis.html

But I also think data visualization is the best idea. It looks like you have a ton of data plotted in a very traditional but limited way (box plots). I also like the idea of subsetting the variables and analyzing individual variables or groups of variables at a time.

PS Welch's ANOVA accounts for high heteroscedasticity.

$\endgroup$
2
  • 2
    $\begingroup$ A Kruskal-Wallis test can only be used when you have independant groups, which is not the case in this example. $\endgroup$
    – Jaap
    Commented Feb 7, 2014 at 10:01
  • $\begingroup$ Oopps! You are absolutely right. I jumped to Kruskal-Wallis due to the problems using ANOVA in this case. I had a similar issue with an experiment I performed last year and saw parallels here. My mistake! $\endgroup$
    – squishy
    Commented Feb 7, 2014 at 20:44

Your Answer

By clicking “Post Your Answer”, you agree to our terms of service and acknowledge you have read our privacy policy.

Not the answer you're looking for? Browse other questions tagged or ask your own question.