4
$\begingroup$

I often see that the sample size for a $z$-test to achieve a particular type II error rate $\beta$ (at a given significance level, $\alpha$) is:

$$n = \frac{(Z_{1-\alpha/2}+Z_{1-\beta})^2\sigma^2}{\delta^2}$$

How do they reach that conclusion/determine that?

$\endgroup$
3
  • $\begingroup$ Your question was a bit muddled/confusing. I have edited, but you'll need to review it to check it's asking what you want. $\endgroup$
    – Glen_b
    Commented Feb 27, 2014 at 23:26
  • $\begingroup$ Such calculations are often called power calculations (power = $1-\beta$). I've removed one of your tags and added a couple of tags relating to power to (hopefully) help with finding related answers in the sidebar. $\endgroup$
    – Glen_b
    Commented Feb 27, 2014 at 23:31
  • $\begingroup$ No doubt someone will write a good answer, but in the meantime, there's an outline of the calculation here. Keep in mind that they're doing a one tailed test calculation (hence the difference with $\alpha$ vs $\alpha/2$), and that $Z_{1-\beta}=-Z_\beta$, and their $d$ corresponds to $\delta/\sigma$. $\endgroup$
    – Glen_b
    Commented Feb 27, 2014 at 23:41

1 Answer 1

4
$\begingroup$

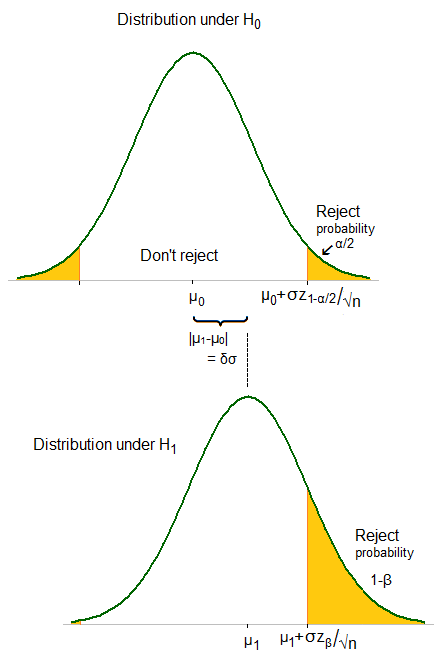
Here's an outline of the basic ideas:
enter image description here

The same critical value, $C$, applies whether $H_0$ is true or $H_1$ is true.

$C=\mu_0+\sigma Z_{1-\alpha/2}/\sqrt{n}$

$C=\mu_1+\sigma Z_\beta/\sqrt{n}$

$\mu_0+\sigma Z_{1-\alpha/2}/\sqrt{n}=\mu_1+\sigma Z_\beta/\sqrt{n}$

$(\mu_1-\mu_0)/(\sigma/\sqrt{n}) = (Z_{1-\alpha/2}- Z_\beta)$

$[(\mu_1-\mu_0)/\sigma]\sqrt{n} = (Z_{1-\alpha/2}+ Z_{1-\beta})$

$\sqrt{n} = (Z_{1-\alpha/2}+ Z_{1-\beta})/[(\mu_1-\mu_0)/\sigma]$

and then you just square both sides

$n = (Z_{1-\alpha/2}+ Z_{1-\beta})^2/[(\mu_1-\mu_0)^2/\sigma^2]$

$\quad = (Z_{1-\alpha/2}+ Z_{1-\beta})/\delta^2$

Note: (1) Here I'm doing just the case $\mu_1>\mu_0$. To cover both possibilities, we really need $|\mu_1-\mu_0|$ where I have $(\mu_1-\mu_0)$; the outcome is the same.

$\quad\quad$(2) This ignores a small piece of area to the far left of the second diagram.

$\quad\quad\quad\,\,\,$When $\delta$ is large, this is negligible.

$\endgroup$
0

Your Answer

By clicking “Post Your Answer”, you agree to our terms of service and acknowledge you have read our privacy policy.

Not the answer you're looking for? Browse other questions tagged or ask your own question.