3
$\begingroup$

I was faced with a problem of automatically detecting regions of continuity in a vector. I have a lot of these vectors, hundreds. One example of such vector is here. Basically looking at the vector, one can see that there are regions of continuity, then it breaks, jumps some value, and then has another region of continuity and so on.

I was provided with this solution by some nice fellow on the newsreader:

v = [ 9 18 21 58 59 60 63 66 69 70 72 74 ...
dv = diff([0 v]);                                       % Create difference vector
dvs = [mean(dv)  std(dv)];                              % Determine mean & std
dvd = [0 find(dv > 1.96*dvs(2)+dvs(1)) length(v)];      % Use ‘dvs’ to detect discontinuities & create index reference vector
for k1 = 1:length(dvd)-1
    vs{k1} = v(dvd(k1)+1:dvd(k1+1)-1);                  % Create cell array of regions-of-interest
    vi{k1} = [dvd(k1)+1 dvd(k1+1)-1];                   % Create reference array of start-end indices for ‘vs’ regions
end

this works wonderfully and uses the 95% confidence interval to find the start and end points of the indexes of the regions. I know it works; I just want to know why and how it works. Statistics is not my strong point, so I have been reading in detail anything I can find related to the provided solution. Statistics is really fascinating me as to how one can make assumptions intelligently based on a sample and find them to be true.

I want to fully understand the working of the solution provided. Based on what I have read and understood, this is my understanding of the explanation (please note I have no base in stats at all, so I may be going very basic here). Can anyone strong in statistics shed some light on this?

A 95% confidence interval is basically saying that I am 95% sure that given mean of a probability is within these limits [a, b]. And this can be calculated with the formula: $x \pm 1.96 (std/\sqrt n)$ where $x$ is the mean, $std$ is the standard deviation and $n$ is the sample size. And this confidence interval applies to a normal distribution only.

Judging by my vector, the samples were observed to be normally distributed samples (between the jumps). Knowing that these are normal distributions, simply finding their confidence intervals will give the start and endpoint of a normally distributed sample. And that is what is going on in this line:

dvd = [0 find(dv > 1.96*dvs(2)+dvs(1)) length(v)];

where find finds the indices of the points where the confidence interval equation holds true, but why the difference vector dv? and why use it in the condition statement? Why even create a difference vector? And why use it in the line above?

This is based on what I read today, so I may be way off. Am I on the right path? Is my understanding correct? Thank you.

$\endgroup$
1
  • $\begingroup$ re 95% confidence interval see, e.g., stats.stackexchange.com/questions/26450/…. The formula is the correct one to use for normally distributed data; for other distributions there are other formulas. $\endgroup$
    – TooTone
    Commented Mar 28, 2014 at 15:53

1 Answer 1

1
$\begingroup$

So to begin a 95% confidence interval is basically saying that I am 95% sure that given mean of a probability is within these limits [a, b].

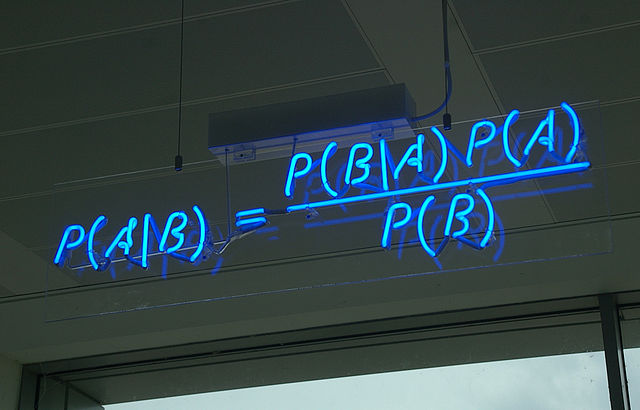
This is incorrect. Specifically you are committing the Fallacy of the transposed conditional. 95% of confidence intervals calculated will include the true mean (if assumptions are correct, etc), but the probability the interval contains the true mean is not 95%. The two are related by Bayes' Rule shown in the picture below, where P(A|B) is the probability the hypothesis is true given the data and P(B|A) is the probability of getting the data observed given the hypothesis is true. P(A) is the probability the hypothesis is true regardless of the data and P(B) is the probability of getting the data whether or not the hypothesis is true.

The confidence interval is calculating P(B|A). A is the hypothesis that the true mean comes from the distribution with observed mean +/- sd/sqrt(n) and B is each other value. It is the same as saying your null hypothesis is that the true mean equals your observed mean and asking at which observed means would you "reject" this null hypothesis. The answer is for values outside mean +/- 1.96*sd/sqrt(n). The problem is that we don't know how probable it is that A is true from this information, you need previous data, theory, or expert opinion to guess that.

https://en.wikipedia.org/wiki/File:Bayes%27_Theorem_MMB_01.jpg https://en.wikipedia.org/wiki/Bayes%27_theorem

This recent paper Robust misinterpretation of confidence intervals may be helpful. Perhaps someone else could explain it clearer than I.

EDIT: Also, the code you were given is detecting discontinuities by looking at the difference between each adjacent value. It then calculates the average difference and sd of the differences. From this we would then say it is likely that differences much larger than usual ( greater than +/- 1.96*sd/sqrt(n) from the average) represent discontinuities. However, as described above, you need prior/other information on what distance between values represent a discontinuity to know if you are properly choosing them.

$\endgroup$
4
  • $\begingroup$ Thanks a lot for that explanation. Since I'm very new to stats I will be lying if I said I understood it completely. My understanding of confidence intervals is from reading online and watching videos explaining it. For example this video: youtube.com/watch?v=CAZmr0kx2WQ calculates the CI and then mentions at 7:00 mark what you have quoted above from my question. This is where I got my understanding of CI from. $\endgroup$ Commented Mar 29, 2014 at 21:04
  • $\begingroup$ your edit helped me greatly as I was looking for an explanation to the code. You are right, it is the difference vector, dv that helps find the discontinuities via the spikes but it is this part that finds these spikes right? m +/- 1.96*sd Is this not the confidence interval equation? If my data is not normally distributed why is this working in detecting these gaps? Can you please shed some light on this, I want to understand this in such a way so that I can explain it further to someone else, please do excuse my insistence on this equation. Thank you $\endgroup$ Commented Mar 29, 2014 at 21:17
  • $\begingroup$ @FarazKhan yes that is the confidence interval equation. The code is similar to saying that the top 5% largest gaps represent discontinuities, while all other gaps do not. Why are you so sure that it is properly categorizing the gaps? There must be other information you are not including in the question. $\endgroup$
    – Livid
    Commented Mar 29, 2014 at 23:01
  • $\begingroup$ @FarazKhan I would suggest you ask a new question here on how to use K-means clustering on your vectors. This will better categorize each gap into "internal" and "discontinuity". $\endgroup$
    – Livid
    Commented Mar 31, 2014 at 15:01

Your Answer

By clicking “Post Your Answer”, you agree to our terms of service and acknowledge you have read our privacy policy.

Not the answer you're looking for? Browse other questions tagged or ask your own question.