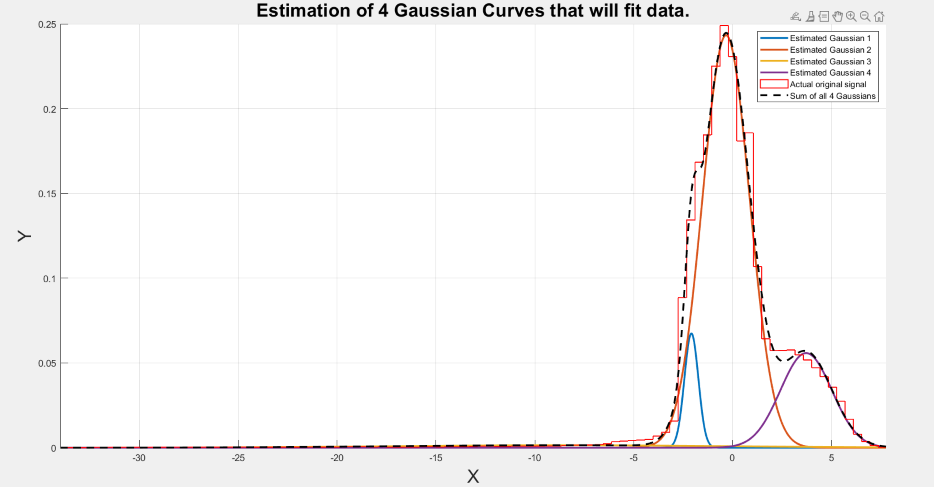
Here it is a solution that you could consider.
First, your goal is to identify the less probable observations, but what do you really mean by less probable? I propose this definition: your goal is to detect a threshold $T$ such that the probability to find any values lower than this threshold is lower or equal than a chosen probability $p$ with $1-\alpha$ confidence level. In math language, if $X$ represents the random variable generated by the distribution shown on your graph, this would be
$$
\mathbb{P}(X \leq T) = p.
$$
Now, because the pdf of your random variable $X$ is really complicated, it would be difficult to find a mathematical expression for $T$. With what it is called a parametric bootstrap method you could approximate this value.
Let us just introduce some notations:
$\theta$ represents the vector that contains the parameter of your mixture of gaussian (namely the different means, standard deviations and weights).
$P_\theta$ represents the distribution of a gaussian mixture with parameter $\theta$.
Here is the algorithm:
Step 1: From your data estimate the parameter $\theta$ and so the distribution $P_\theta$ just as you did already.
Step 2: Suppose that your dataset is of size $n$. By simulation, draw n data from the mixture of gaussian $P_\theta$.
Step 3: order your dataset in increasing order and choose the $p\times n$ lowest value $T_1$.
Step 4: repeat step 2 and 3 B times (typically $B = 1000$) such that you have $B$ different lowest values $T_1, T_2, \cdots ,T_B$.
Step 5: order the data $T_1,T_2,\cdots,T_B$ in increasing order.
If you want a $1-\alpha$ lower bound for $T$, then takes the $\alpha B$ smallest value among the $T_i$.
If you want a $1-\alpha$ upper bound then take the $(1-\alpha)B$ lowest value among the $T_i$
If you want a $1-\alpha$ confidence interval then choose as the lower bound the $\alpha B/2$ lowest value and as an upper bound the $(1-\alpha/2)B$ lowest value among the $Ti$.

