5
$\begingroup$
  • I realize that decision trees are nonparametric methods

  • What should residual vs. actual/fitted look like for a well behaved regression tree?

  • My argument would be that since each observation assigned to a terminal node is assigned (as a predicted value) the average of the dependent variable at that terminal node, you would expect the conditional distribution (that is, for each node) to be approximately normal.

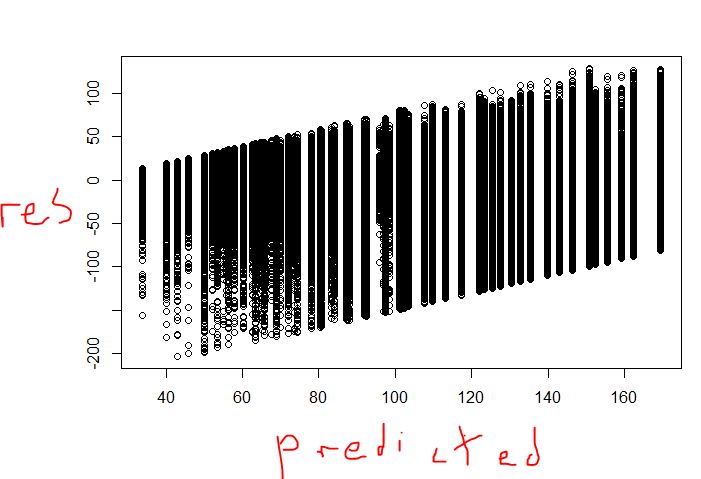
  • I have attached two plots for my decision tree (validates at 63% on test set, so kind of weak), residuals vs. fitted and residuals vs. actual -Basically, my question: wouldn't a strong regression tree look like a step-function of sorts?
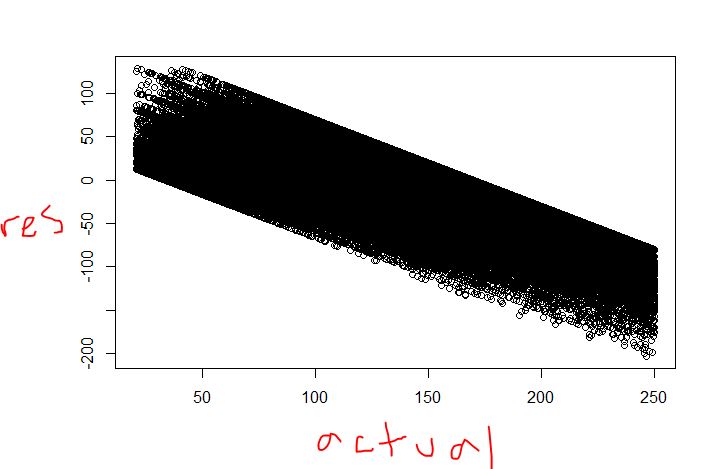
Residuals vs. actual

Resdiduals vs predicted

$\endgroup$
2
  • $\begingroup$ Just as an aside: you can use xlab="predicted" and ylab="res" as arguments to plot() in R. $\endgroup$
    – Momo
    Commented Apr 25, 2014 at 11:45
  • $\begingroup$ Thank you haha. I had taken screen shots way after the fact and didn't have time to rerun and label everything properly. $\endgroup$
    – user44450
    Commented Apr 25, 2014 at 13:23

1 Answer 1

1
$\begingroup$

The prediction will look like a step function, but not the plots you include.

The residual vs actual plot looks ok to me. I have seen plots like that one even in regression. In regression, the diagonal patterns pop up when you have many observations with the same $X$s. Take a group that have the same prediction and index with $i$. The idea is that if the $X$s are the same, then the plot will be $\hat{y}_{i} - y_{i} = r_{i}$ but $\hat{y}_{i}=p$ so on the plane with $(y,r)$ axes it looks like a straight diagonal line. In regression tree you have many groups where the prediction is identical, so the pattern should come up.

The second plot does look strange. Is that plot for the train set or the test set? If its the train set, is every point visible? In the train set I would expect residuals to be centered at 0, assuming that you built the tree to minimize the unexplained variance and that each observation has the same weight.

$\endgroup$
2
  • $\begingroup$ Your first comment makes a lot of sense, it's essentially a family of linear functions for each prediction p. For your second question , that is the training set. You would expect the residuals to be centered around zero only as a Markov assumption for linear regression, but no distribution is assumed for regression trees. I think if you use your logic in the first comment it helps to see why the second plot is the way it is... $\endgroup$
    – user44450
    Commented Apr 27, 2014 at 18:56
  • $\begingroup$ I was not relying on a Markovian assumption. I thought that the regression tree makes cuts to reduce the squared error within the groups. The best way to do this is to predict at the mean of the group, which would imply residuals centered at 0. That's why I asked if these were weighted or if some of the points were not visible on the plot. I am intrigued, I'll think about it some more, but do throw a hint! $\endgroup$
    – Bruno
    Commented Apr 27, 2014 at 23:49

Your Answer

By clicking “Post Your Answer”, you agree to our terms of service and acknowledge you have read our privacy policy.

Not the answer you're looking for? Browse other questions tagged or ask your own question.