5
$\begingroup$

To asses differences between two DNA sequencing methods (454 and MiSeq) I have made artificial mixtures of different bacteria in the lab (mock communities).

An Example might be (numbers are percentages of bacterial cells in the sequenced samples):

  • Bacterial strain A: 25%
  • Bacterial strain B: 25%
  • Bacterial strain C: 25%
  • Bacterial strain D: 25%

I have also more complex mixtures (up to 20 different bacteria and other ratios than 1:1, for exp. logarithmic)

If you sequence this you get for example the following results:

454:

  • A: 20%
  • B: 30%
  • C: 24%
  • D: 26%

Illumina:

  • A: 22%
  • B: 28%
  • C: 20%
  • D: 30%

From every sample (like the one above) I have triplicates.

What statistical test would you suggest to test if there is a significant difference between the two methods (I guess analysing the difference in ratios is the right thing?). Is Chi-Square the right thing if I have three different samples (One is the one mentioned above)? Would even some bootstrapping approach be an idea?

I am familiar with R, so if there is any package you can suggest, that would be nice as well...


An image to explain the workflow. I hove this helps to understand my problem better: Workflow
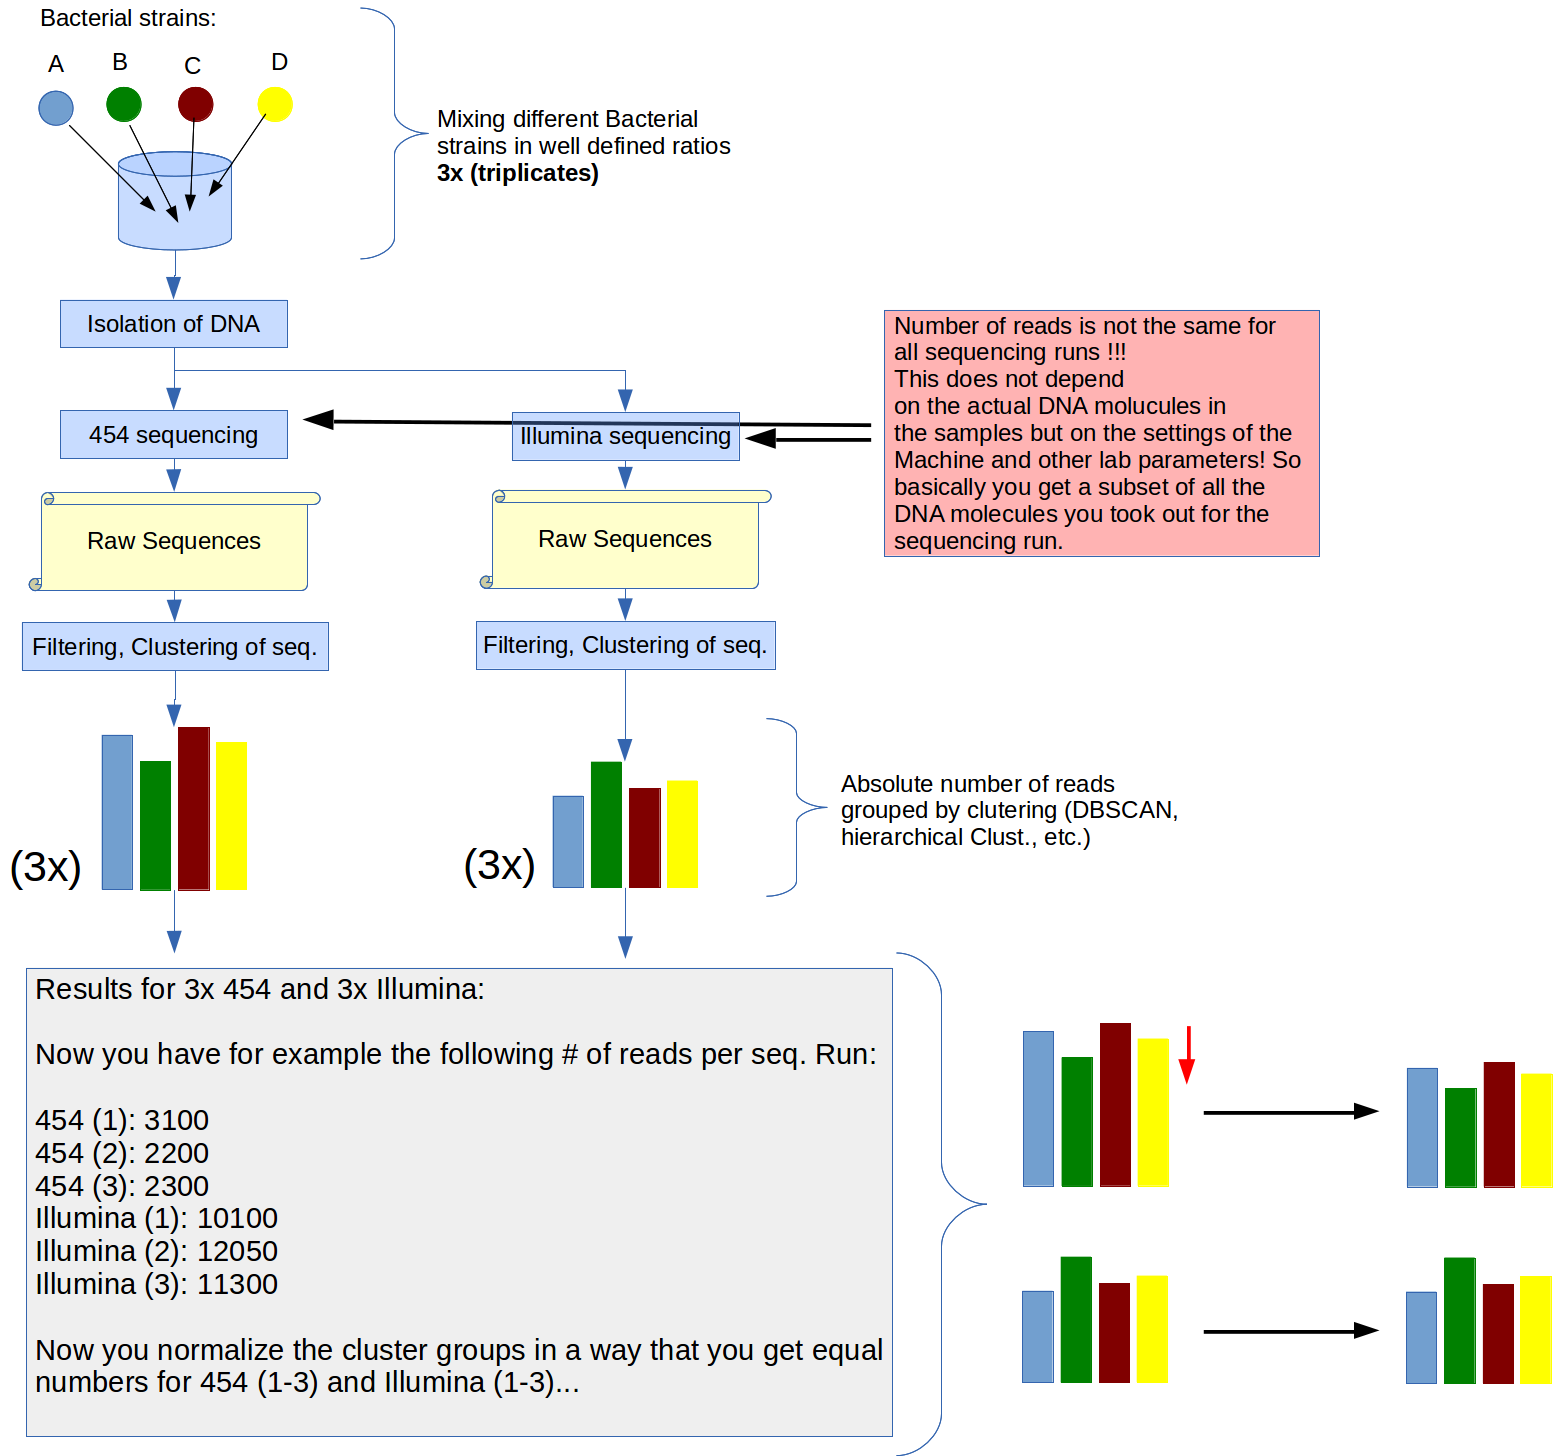
I also have mock communities that are more complex (10 or 19 bacterial strains in different ratios). But the principle is the same.

For the sequencing process you decide how many DNA sequences you want to sequence! The number of reads (Sequences you get) are not (only) a matter of DNA concentration (as long as you have enough DNA to have a "satturation"). So what you can compare at the end between 454 and MiSeq are rather ratios (after clustering) than complete numbers, as far as I understand...

$\endgroup$
8
  • $\begingroup$ chi-square might work if you had counts, not just percentages $\endgroup$
    – Glen_b
    Commented Jun 4, 2014 at 14:07
  • $\begingroup$ I have the counts! But does that make a difference? I have to normalize anyway, because the sequencing reads are proportional to the total reads per sequencing run. It's hard to tell something about absolute numbers... $\endgroup$
    – Michael
    Commented Jun 4, 2014 at 14:10
  • $\begingroup$ Yes, in order to work out the vriability of the proportions. It's like tossing coins. If I wonder whether two coins give the same proportion of heads, and I get the result that A gave heads 70% of the time and B gave heads 60% of the time, it makes a lot of difference whether I tossed 10 times or 1000 times. $\endgroup$
    – Glen_b
    Commented Jun 4, 2014 at 14:15
  • $\begingroup$ The point is that the number of seq.-reads are in the same range. So if I just normalize, is the bias I introduce acceptable? $\endgroup$
    – Michael
    Commented Jun 4, 2014 at 14:27
  • $\begingroup$ You should explain in detail the thing you are adjusting by to remove bias. The inputs to the numbers you give us. There will almost certainly be another way to deal with the problem if we know clearly what it is. At the least we may be able to derive a variance-function that works for the data you have. $\endgroup$
    – Glen_b
    Commented Jun 4, 2014 at 21:34

1 Answer 1

2
+50
$\begingroup$

Is your null hypothesis that the methods are different, or is your null hypothesis that a given dataset is drawn from your mixture? They are two different things, one demands that you test each separately against, e.g., 1/4, 1/4, 1/4, 1/4. The other ignores the fact that you know what the truth is and just asks do the two sequencing platforms give different results.

For the first, you don't need to do any normalization. Just use chi-squared goodness of fit test directly. You compare the counts to the known probabilities, e.g., 1/4,1/4,1/4,1/4. Then to compare the methods, you can ask which statistic is smaller (here you would want to normalize because the p-value is going to be count dependent).

One way to do that cheap and dirty is to just subsample an equal number of counts from each platform and then do the above comparison, repeat 100 times, and now you have two distributions of p-values representing the goodness of fit test stats. If one platform is better it will have larger p-values. From the above numbers you posted, it is clear that both will reject the null of a "good fit", but maybe one method is much closer to a good fit.

To compare the platforms against one another, I would recommend a glm. You can see how to use them in this paper (http://www.biomedcentral.com/1471-2105/11/94 and http://genomebiology.com/2010/11/10/r106 (don't worry that those are about transcriptomics, it's just counting statistics for both in the end)). Basically, you'd be testing for whether a "platform" effect exists. The normalization would come into the glm offsets. Your model would be:

Count ~ platform * bacteria

Each of your replicates would be one row in the table. Since there are only two levels on the platform it's just a t-test.

$\endgroup$
1
  • $\begingroup$ Jimmyb, I will try the glm! Thanks in the meantime! :-) $\endgroup$
    – Michael
    Commented Jul 2, 2014 at 13:27

Your Answer

By clicking “Post Your Answer”, you agree to our terms of service and acknowledge you have read our privacy policy.

Not the answer you're looking for? Browse other questions tagged or ask your own question.