2
$\begingroup$

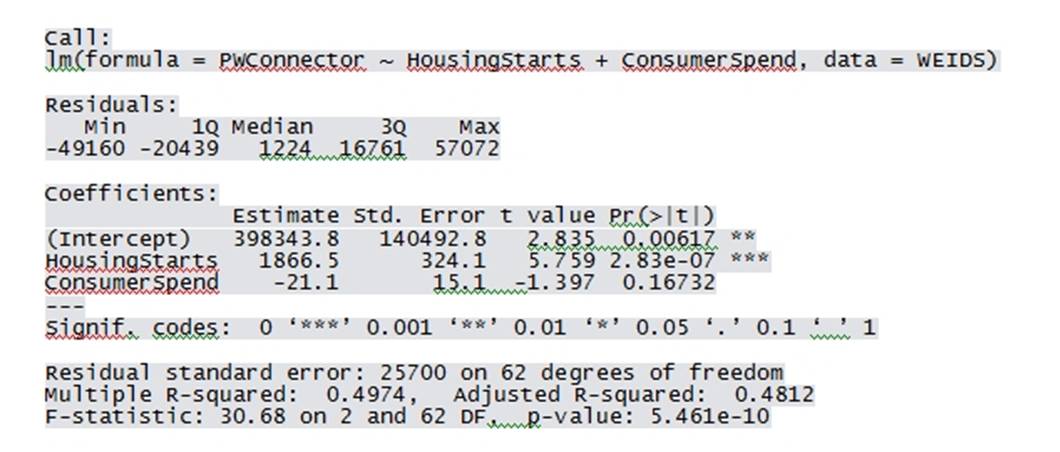
I'm running a statistical analysis for work in which I'm trying to determine which (if any) key economic indicators influence our sales. Here is the summary data that I'm getting when I run a multiple regression:
enter image description here

It appears to me that the overall regression has strong significance, as does the HousingStarts variable. The R-squared and Adjusted R-squared values also appear to indicate strong correlations. My question is on how I should interpret the ConsumerSpend variable, which has a somewhat high p-value. Does that indicate a weak correlation to the overall regression and therefore I should disregard it, or does the overall p-value trump the individual variable p-value? I should note that I ran separate linear regressions for the two variables, and both of the p-values were well below .001 (although the R-squared and adjusted R-squared for the ConsumerSpend regression was .2285 and .2163, respectively). Sorry if this is a basic question, but I took one stats class in business school, and I'm trying to apply what I learned!

$\endgroup$

2 Answers 2

9
$\begingroup$

The two predictors are correlated -- housing starts can predict consumer spending well enough that the latter is not needed very much in addition to housing starts to help predict sales. For simplicity you can probably get by with the simpler one-variable model using housing starts.

And don't forget to actually look at the results. In my experience, some people get too dazzled by asterisks and p values and don't pay enough attention to the values of their estimates. In this example, the one-variable model is also much easier to interpret. For example, you can draw a scatterplot of the data and superimpose the fitted line.

Even for the two-predictor model, you can make a little table showing what you predict for some typical values of consumer spending and housing starts, and give a prediction interval so people know how widely they can expect future results to vary from your predictions. In R, that's done using the predict function, giving a hypothetical dataset in newdata argument, and specifying interval="predict"

$\endgroup$
7
$\begingroup$

The p-value for ConsumerSpend is measuring the effect of ConsumerSpend above and beyond (or conditioning on) the other terms in the model (HousingStarts in this case). This means that while ConsumerSpend may be related to PWConnector, that the information is redundant once HousingStarts is taken into account. This is probably at least partly due to a relationship between ConsumerSpend and HousingStarts.

Think about trying to predict the weight of adult males (response variable) and you have the 2 predictors: height in inches and height in centimeters. Now either will be correlated with weight and give you predictive power, but once you have one in the model, the other will probably not contribute much. Your case is more like having height and shoe size, shoe size is probably somewhat predictive, but would not give us much additional information if we already have height, but height would contribute information beyond shoe size.

What to do with the ConsumerSpend variable depends on what question you are trying to answer.

$\endgroup$
1
  • $\begingroup$ Excellent! That really helps settle the issue for me. Given that I'm looking for a correlation to economic indicators, I'll remove it from the regression, as the r-squareds are not impacted much when I factor in just HousingStarts. Thanks for the help! $\endgroup$ Commented Jul 23, 2014 at 16:55

Your Answer

By clicking “Post Your Answer”, you agree to our terms of service and acknowledge you have read our privacy policy.

Not the answer you're looking for? Browse other questions tagged or ask your own question.