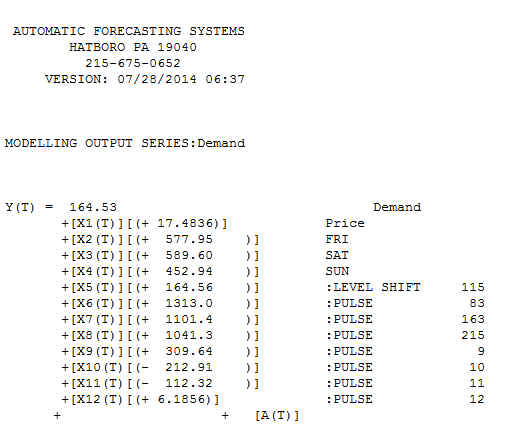
The short answer is that a thorough analysis of your data suggests a positive impact due to price.  where for every $ increase in price demand is expected to increase by 17.5 units. This result could reflect an omitted variable e.g. a competing product's price became much higher thus shifting demand to your product even though the price was "high". A simple OLS solution for your data which ignores day effects and night\day effects and increased changes in demand (around 6/2/13 ) would suggest a coefficient of 31.2
  . We normally see demand/price data where sales are made every day save some holidays thus we can tease out specific-day-of-the=week,week-of=the-month, patterns around known events, level shifts , weekly effects, monthly effects etc. and lagged responses to price changes and even lead responses to future price changes. Your data is of course intermittent and is not totally amenable to all of the high-powered functionality of AUTOBOX a piece of software that I have helped develop.
In closing you delivered 217 observations with one blank day (7/4/13). Using 216 days AUTOBOX detected a level shift at 6/2/13 and a number of very unusual days
4/3/13,4/2/14,7/22/14,4/25/12,5/4/12,5/5/12,5/6/12 in addition to a day/night effect and a day type effect.
I hope this helps you. IF you wish to communicate specifically about the anything you can either respond here or contact me .

 where for every $ increase in price demand is expected to increase by 17.5 units. This result could reflect an omitted variable e.g. a competing product's price became much higher thus shifting demand to your product even though the price was "high". A simple OLS solution for your data which ignores day effects and night\day effects and increased changes in demand (around 6/2/13 ) would suggest a coefficient of 31.2
  . We normally see demand/price data where sales are made every day save some holidays thus we can tease out specific-day-of-the=week,week-of=the-month, patterns around known events, level shifts , weekly effects, monthly effects etc. and lagged responses to price changes and even lead responses to future price changes. Your data is of course intermittent and is not totally amenable to all of the high-powered functionality of AUTOBOX a piece of software that I have helped develop.