1
$\begingroup$

I ran an ordinal logistic regression in R using the polr function on a survey analysis dataset. The responses of the dependent variable range from Poor to Excellent. The responses to the independent variables range from 1 to 5 (1 being Poor and 5 being Excellent). I obtained the following result:
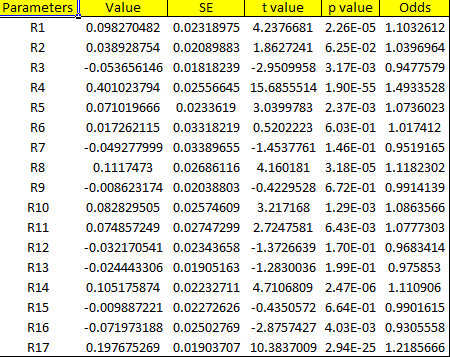
enter image description here

I want to measure the individual percentage contribution of my independents (R1, R2,...,R17) to the dependent variable.

Is there a way to do this.

Thanks for any help.

$\endgroup$

2 Answers 2

3
$\begingroup$

Remember that you used maximum likelihood estimation which optimizes the likelihood function. Use this to your advantage - it is the gold standard statistical measure, with only penalized likelihood or Bayesian analysis (which also uses the likelihood) being better. Compute the proportion of the total likelihood ratio $\chi^2$ statistic for the model that is due to each variable in the model. You can do this by running a series of anova() commands. To get this easily using the more approximate Wald $\chi^2$ statistics instead of likelihood ratio $\chi^2$ statistics, use something like:

require(rms)
f <- orm(y ~ x1 + x2 + ....)  # default = proportional odds model
a <- anova(f)
a   # print table
plot(a)   # plot results on chi-square minus d.f. scale
plot(a, what='proportion chisq')   # plot what was described above
$\endgroup$
0
$\begingroup$

There is no general way to do this because the contribution of each variable will be different at different levels of the other variables. This is true in any logistic regression. But you can look at the contribution at particular levels of the other variables. In SAS there is a slice statement that does this. There is probably something similar in polr but you'd have to look at the documentation.

$\endgroup$
2
  • $\begingroup$ In the usual form of logistic regression, the predicted log odds will be a linear function of the independent values, which would seem to contradict the claim that the "contributions" will vary with the levels of the variables. That seems to assert there is necessarily some kind of interaction term in all logistic regressions, which obviously is not the case. What exactly do you mean by "contribution" then? $\endgroup$
    – whuber
    Commented Aug 14, 2014 at 14:41
  • $\begingroup$ I meant that the contributions vary in terms of the probabilities. You are right that they are linear in the log odds, but log odds aren't very intuitive (at least, not to me or most people I've talked to). $\endgroup$
    – Peter Flom
    Commented Aug 15, 2014 at 10:24

Your Answer

By clicking “Post Your Answer”, you agree to our terms of service and acknowledge you have read our privacy policy.

Not the answer you're looking for? Browse other questions tagged or ask your own question.