1
$\begingroup$

Breusch-Pagan rejects the H0 on this residuals:

> length(model$residuals)
[1] 515959
> summary(model$residuals)
    Min.  1st Qu.   Median     Mean  3rd Qu.     Max. 
-205.000   -4.420   -0.451    0.000    4.130  196.000 
> quantile(model$residuals, seq(0, 1, 1/10))
         0%         10%         20%         30%         40%         50%         60%         70%         80%         90%        100% 
-205.228344  -10.137559   -5.705923   -3.400891   -1.814776   -0.450546    1.036849    2.914375    5.648389   10.733350  196.011350 
> bptest(model)

    studentized Breusch-Pagan test

data:  model
BP = 1385.57, df = 14, p-value < 0.00000000000000022

Looking at the residuals variance with @whuber visualization function I don't see any heteroskedasticity issue:
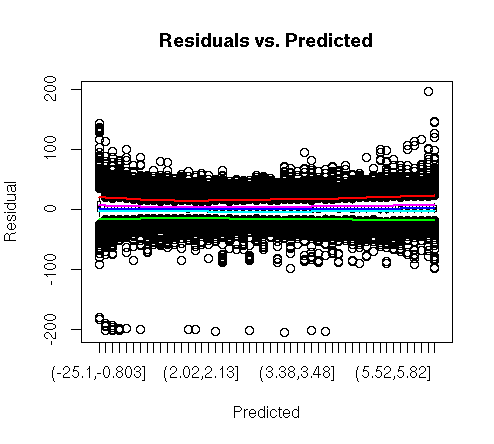
ResidualsvsPredicted

So yes, there are some extreme observations at the tail of distribution, but is this enough to reject the H0?

Manual Breusch-Pagan test

summary(lm(I(model$residuals^2) ~ data$X1 + data$X2 + data$data$X3 + data$X4))

Call:
lm(formula = I(model$residuals^2) ~ data$X1 + data$X2 + 
    data$dataX3 + data$X4)

Residuals:

   Min     1Q Median     3Q    Max 
  -356   -100    -79    -23  41965 

Coefficients:
                    Estimate Std. Error t value             Pr(>|t|)    
(Intercept)           176.52       4.82   36.66 < 0.0000000000000002 ***
data$X1                -5.21       0.28  -18.60 < 0.0000000000000002 ***
data$X2               -75.36       4.75  -15.88 < 0.0000000000000002 ***
data$X3                15.70       0.85   18.48 < 0.0000000000000002 ***
data$X4fact2           10.84       3.15    3.44              0.00059 ***
data$X4fact3            1.14       2.15    0.53              0.59735    
data$X4fact4           96.31       6.98   13.80 < 0.0000000000000002 ***
data$X4fact5          191.39      12.73   15.04 < 0.0000000000000002 ***
data$X4fact6            3.44       4.03    0.85              0.39280    
data$X4fact7            8.30       2.79    2.97              0.00298 ** 
data$X4fact8           19.38       2.66    7.29     0.00000000000031 ***
data$X4fact9            1.44       2.37    0.61              0.54468    
data$X4fact10          46.35      11.19    4.14     0.00003435124602 ***
data$X4fact11          -6.23       2.71   -2.30              0.02168 *  
data$X4fact12          18.07       3.46    5.22     0.00000017455269 ***
---
Signif. codes:  0 ‘***’ 0.001 ‘**’ 0.01 ‘*’ 0.05 ‘.’ 0.1 ‘ ’ 1

Residual standard error: 502 on 515944 degrees of freedom
Multiple R-squared:  0.00269,   Adjusted R-squared:  0.00266 
F-statistic: 99.2 on 14 and 515944 DF,  p-value: <0.0000000000000002
$\endgroup$
6
  • 1
    $\begingroup$ You seem to have quite a high N, right? This may just be a consequence of the fact that with a sufficiently large N, any deviation from H0 will get significant. I'd assume that, for instance, the large number of residuals clustered around -200 should "not happen" under normality. $\endgroup$ Commented Aug 27, 2014 at 16:01
  • $\begingroup$ Yes, N is 1/2 million, I added it to the code. $\endgroup$ Commented Aug 27, 2014 at 16:15
  • $\begingroup$ Well. Using a SD of 6 (to roughly match your 1st and 3rd quartile), R gives me a probability of seeing a single -200 of 6.35e-244. You seem to have at least 15 or 20 residuals of -200. It seems like your tails are simply way too heavy to be expected from a normal distribution. Combine that with your large N, and any normality test will likely reject. You may be better served with the question whether you really need normality at all, given your huge N. $\endgroup$ Commented Aug 27, 2014 at 16:25
  • $\begingroup$ Why the bptest would fail if the $Y$ observations are not normally distributed? I don't see how that relates to the residuals. And even if the residuals are not normally distributed, why a bptest would fail to reject? I don't think homoskedasticity implies a normal distribution... $\endgroup$ Commented Aug 27, 2014 at 17:07
  • $\begingroup$ You are right. The problem probably rather is that the -200 residuals cluster at low fitted values. $\endgroup$ Commented Aug 27, 2014 at 19:41

1 Answer 1

2
$\begingroup$

The best way to see what happened is to perform BP by hand, e.g. as explained here.

As you regress the squared residual on your predictors, you will be able to learn what particular predictor explains variance in residuals and whether there is any practical significance. E.g., if R-squared is 0.001, then it looks like the test has too much power due to a large sample size. Also, it may be the case that it's enough to delete a few outliers to make it go away, which may be preferable to doing WLS. Finally, if you do WLS you may find out that the results are virtually the same as if you ignored BP test altogether.

$\endgroup$
13
  • $\begingroup$ I added the manual BP test to the question. $\endgroup$ Commented Aug 27, 2014 at 17:10
  • $\begingroup$ With R-squared well below 1%, it looks like you don't have to adjust for heteroskedasticity. I bet that even if you run WLS, the p-values and all will remain virtually the same. $\endgroup$
    – James
    Commented Aug 27, 2014 at 19:22
  • $\begingroup$ ok, but why the test doesn't reject then? $\endgroup$ Commented Aug 27, 2014 at 19:33
  • 1
    $\begingroup$ As Stephan guessed correctly, the problem is your huge sample size. It has the same problem as the normality tests described here: stats.stackexchange.com/a/2498/54099 $\endgroup$
    – James
    Commented Aug 27, 2014 at 19:35
  • $\begingroup$ For the same reason, you can't rely just on the p-values in your original regression because even tiny p-values may have little practical significance. In addition, try looking at the partial R-squareds. $\endgroup$
    – James
    Commented Aug 27, 2014 at 19:37

Your Answer

By clicking “Post Your Answer”, you agree to our terms of service and acknowledge you have read our privacy policy.

Not the answer you're looking for? Browse other questions tagged or ask your own question.