5
$\begingroup$

I have this idea in my head that is either bunk or has a name I don't know. (I'm not naive enough to think I'm breaking new ground here!)

Here's my scenario: I would like to know the proportion of a population that has disease x. Instead of taking a random sample of the population, I'm taking what I'm calling a priority sample, which is I start with the people who are most likely to have the disease, then after finding them I go to the next priority or the next most likely. After I test so many, I have a positivity proportion. The more I test, the further down the priority list I get, and the lower my positivity proportion. At some point I stop and then taking my positivity proportion and the number I've tested, I apply it to some distribution (skewed I would guess) and get an estimate of what the actual proportion of the population has the disease with some kind of confidence interval.

Already with this I could imagine I could guess some kind of upper bound after some 10-15 positive tests since the true proportion in the population is unlikely to be higher than my positivity proportion since I started with the highest priority.

Does this method exist? If so, can you steer me in the right direction to learn how to do it properly?

EDIT

After mulling it over a bit, I realize there's one more detail I haven't included here, which is that I know the size of the total population and therefore can tell you the testing coverage.

In lieu of some fantastic mathematical proofs, I made a few simulations.

First I take a population of 1000 and divide them up into 100 groups of 10. Each of these have some proportion of the disease normally distributed around the population mean which I want to estimate. (I'm setting it at 0.2 here.)
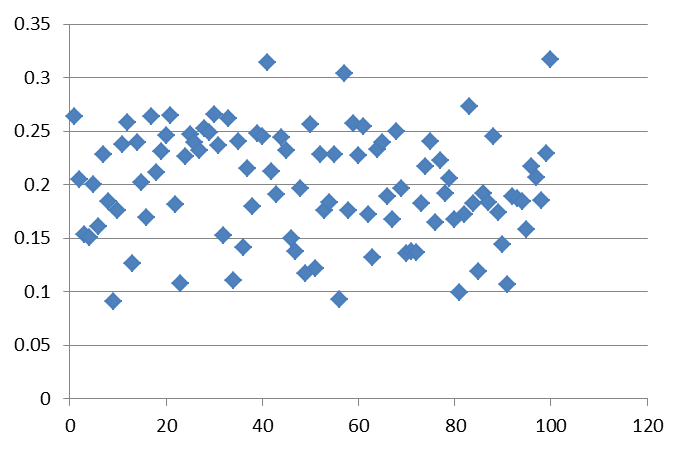
enter image description here

I then order these groups into the highest proportion (priority) to lowest.
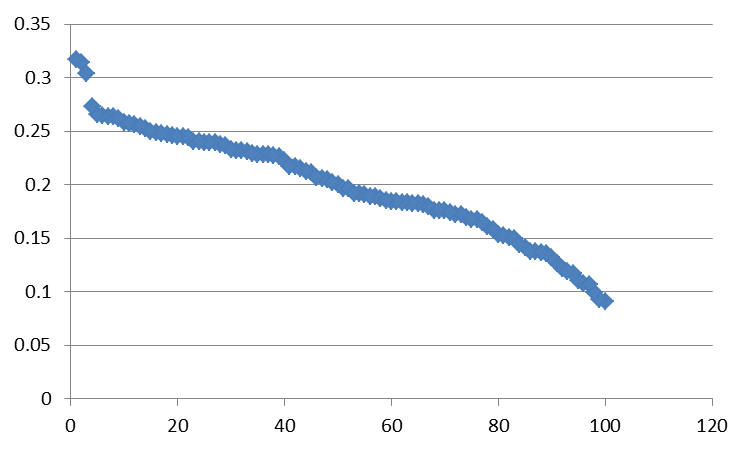
enter image description here

So if I were keeping track of my 10-person groups, when I reached the median group (50) I would have the population proportion. But the more common way is a cumulative collection. So if I graph the proportion cumulatively I get this.
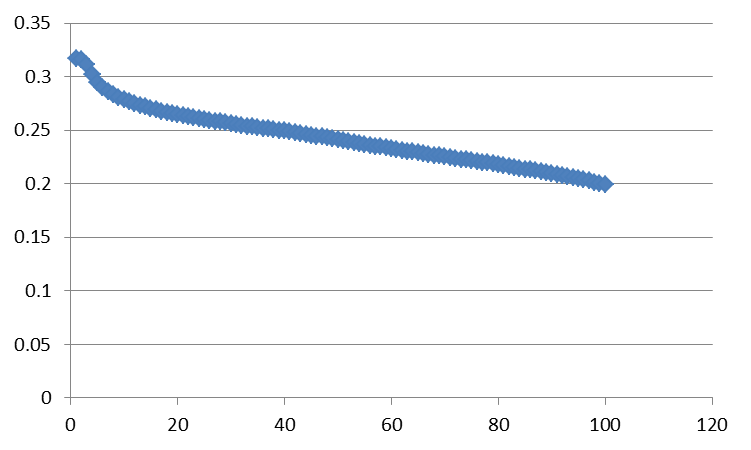
enter image description here

This is surprisingly linear after about 20% coverage. And the true proportion seems to lie about 10% below the coverage at 20% for all but the extreme population proportions. So if this slope is consistent, then I could take the population coverage and extend it linearly to 100%.

$\endgroup$
2
  • 1
    $\begingroup$ This is very close to Ranked Set Sampling but it sounds like a sequential version thereof. I doubt you'll find a textbook account, but maybe somebody has analyzed it in the literature. $\endgroup$
    – whuber
    Commented Mar 3, 2020 at 17:21
  • 1
    $\begingroup$ Thank you @whuber for this trip down memory lane! I'm excited to look into ranked set sampling. $\endgroup$
    – Tom
    Commented Mar 5, 2020 at 6:18

2 Answers 2

1
$\begingroup$

Sounds like stratified sampling http://en.wikipedia.org/wiki/Stratified_sampling.

$\endgroup$
2
  • $\begingroup$ Thanks for the suggestion. I don't think this is quite what I'm after since my version of sampling starts at one tail (not random) and doesn't cover the whole distribution (stratified or otherwise). I'm calling this "priority sampling" for now. $\endgroup$
    – Tom
    Commented Sep 8, 2014 at 6:56
  • 1
    $\begingroup$ You are correct, Tom: this is not stratified sampling. $\endgroup$
    – whuber
    Commented Mar 3, 2020 at 17:20
1
$\begingroup$

I would like to know the proportion of a population that has disease x.

Assuming that this is your end goal, your sampling plan is not a good one.

At some point I stop and then taking my positivity proportion and the number I've tested, I apply it to some distribution (skewed I would guess) and get an estimate of what the actual proportion of the population has the disease with some kind of confidence interval.

The distribution that you are looking for here is dependent upon the population distribution. The magic of taking a random sample is that the sampling distribution (for simple random samples) of various population statistics tend to behave nicely in expectation even for poorly shaped population distributions. This last point is key, because otherwise you need to worry about the "worst case scenario". Since your method is not guaranteed to perform well even in the worst case scenario, let's contemplate what might happen if you attempt to do priority sampling in a particular situation.

Suppose that we have a population where 90% of people have a disease, and 10% do not. Furthermore, we have 100 groups of people. For the sake of argument, let's consider the situation where those 100 groups are each either full of people who have the disease or do not. We "priority sample" the top 90 groups. What is our result? Our estimate of the percent of people who have the disease is 100%, which is incorrect. If we attempt to "account" for the discrepancy in some methodical fashion, we will still get an overestimate of the true population proportion (since the remaining population all lack the disease: the worst case scenario for your estimator). This is what is referred to as a biased estimator. Generally, we want an unbiased estimator, which means that our estimator is "on average" the true population value.

Worse, accounting for the skewed sample after the fact relies crucially on the real-world problem, and isn't helped by the mathematics. To illustrate: it might have turned out that the remaining 10 groups all had the disease (100%). The priority sampling estimate therefore only tells us that the proportion is somewhere between 90% and 100%. The magic of random sampling is that we can obtain probabilistic bounds on the proportion for any population distribution, so long as we perform our sampling randomly. Since our counterexample shows that your method hinges crucially on the actual population distribution, there can be no such bounds.

OTOH, if your objective was to obtain a lower bound for the proportion, then your method might be helpful. Of course, you'll have to make some very restrictive assumptions on the distributions for the groupings, which will be a hard problem to overcome, but I suppose it's not impossible.

$\endgroup$
6
  • 1
    $\begingroup$ Let's be cautious here. Your argument seems to apply, with no change, to many legitimate sampling procedures, such as regression sampling. I think the potential error lies in assuming that an estimator appropriate for simple random sampling would be appropriate for this sampling procedure--but it's not. As such your discussion may be confusing insofar as it does not distinguish biases in estimation procedures from biases in sampling procedures. The core of your criticism still looks good, but note that the problems can be overcome by also sampling some of the lowest priority groups. $\endgroup$
    – whuber
    Commented Mar 3, 2020 at 19:35
  • $\begingroup$ @whuber "note that the problems can be overcome by also sampling some of the lowest priority groups" this is not the case. Although one could then establish both upper and lower bounds for the population value, there would be no way to have any estimate for the "middle" values. $\endgroup$
    – Him
    Commented Mar 3, 2020 at 23:19
  • $\begingroup$ @whuber "As such your discussion may be confusing insofar as it does not distinguish biases in estimation procedures from biases in sampling procedures." This is interesting. I would be very curious for you to elaborate on this matter. $\endgroup$
    – Him
    Commented Mar 3, 2020 at 23:19
  • 1
    $\begingroup$ Re "this is not the case"" This is precisely what ranked set sampling does, so I refer you to the literature on that. The idea is that if there is any positive correlation between the variable used to prioritize the items for sampling and the results, it can be exploited to produce more precise estimates provided a suitable estimator is used. If, say, one were to treat a ranked set sample as if it were a simple random sample, then the resulting estimator could be biased and it certainly would produce the wrong standard error: that's why estimators are intimately connected with sample design. $\endgroup$
    – whuber
    Commented Mar 3, 2020 at 23:21
  • $\begingroup$ @whuber from this paper on ranked set sampling, the authors specifically seek to sample all of the rank strata, rather than sampling only the top and the bottom. $\endgroup$
    – Him
    Commented Mar 3, 2020 at 23:32

Your Answer

By clicking “Post Your Answer”, you agree to our terms of service and acknowledge you have read our privacy policy.

Not the answer you're looking for? Browse other questions tagged or ask your own question.