Your mean and variance are correct.
The important thing is to draw a diagram of the probability you're trying to evaluate. This will make it obvious how to do the calculation.
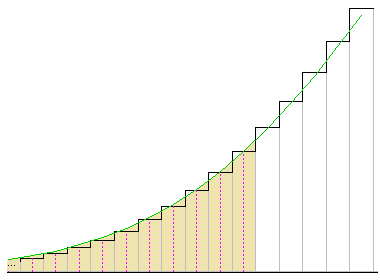
Here's an example of the sort of diagram people usually draw:
$\hspace{1cm}$
(strictly speaking the correct diagram to draw would actually be of the cdf, but most people seem to find this type of diagram easier to follow).
The red dashed lines are the probability spikes whose total probability you're trying to find. The probability they represent is equal to the area of the step-function formed by taking a box of the same height and width 1 centered at the ordinate of the probability spike. The shaded part shows the continuous approximation.
(If you do it right, you can see immediately that you need a value larger than 6, not smaller than 6.)
The continuity correction doesn't really help in this case, though. [Further, in this case, it's easier to compute the exact answer ((1+4+10)/6^4) than approximate it.]

