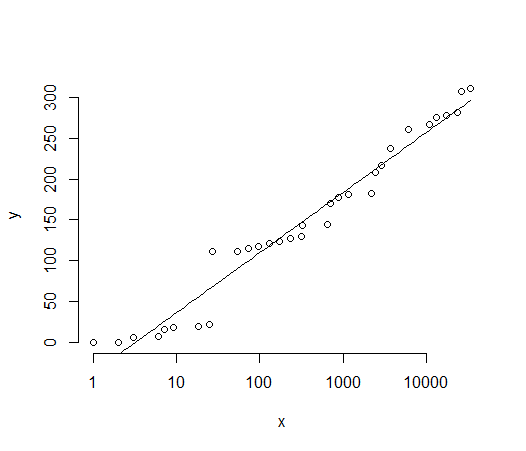
Using a logarithmic regression tool found at xuru.org ( http://www.xuru.org/rt/LnR.asp#CopyPaste ) and the data from below, the curve of the graph for this data is roughly described by y = 31.78303295ln(x) - 36.17569359, which has an RSS value of 10877.59526. My goal is to find an equation that describes the data accurately enough so that I can then multiply it by some smallish constant and the resulting y value will always be above, yet still reasonably close to, the expected y value.
As it is, the errors for the calculated y values stray (+ or -) from the actual value in a roughly sinusoidal manner. The errors for the data below are as follows:
expected       Calculated         Error
0            -37.0769275         37.0769275
1            -14.88358987        15.88358987
7            -1.901319596        8.901319596
8             20.29201803        12.29201803
16            25.22764812        9.227648123
19            33.27428831        14.27428831
20            55.46762593        35.46762593
23            65.98574081        42.98574081
111           68.44989621        42.55010379
112           90.64323384        21.35676616
113          100.2959388         14.70406121
118          109.3971665         8.602833487
121          118.5256062         2.474393843
124          127.5499778         3.549977828
127          137.1795899         10.17958994
130          146.9062597         16.9062597
143          148.3072802         5.307280243
144          170.2548897         26.25488974
170          172.8139194         2.813919413
178          179.674946          1.674946009
181          188.876822          7.876821965
182          209.6750859         27.67508586
208          212.9576731         4.957673121
216          218.3963188         2.396318798
237          226.0826215         10.91737846
261          242.3657911         18.63420891
267          260.7888986         6.211101379
275          266.8441652         8.155834795
278          276.0074897         1.992510289
281          285.2181035         4.218103464
307          289.1736918         17.8263082
310          297.2291502         12.77084978
Bearing in mind that I know very little about statistics, my questions are:
Why is it that when I add more data points the RSS value becomes worse? e.g. the next data point following "34239 310" is "35655 323". When added to the set below and regression is done on the updated set, I get y = 32.38336295 ln(x) - 38.48210346 with RSS=11417.26182.
As the value of x increases, the results become increasingly inaccurate (namely, y consistently falls well below the target value). How should I interpret this?
Given that the errors seem to fluctuate in a sine-like manner, is there some way to use this knowledge to improve the results of the function?
data set:
1,0
2,1
3,7
6,8
7,16
9,19
18,20
25,23
27,111
54,112
73,115
97,118
129,121
171,124
231,127
313,130
327,143
649,144
703,170
871,178
1161,181
2223,182
2463,208
2919,216
3711,237
6171,261
10971,267
13255,275
17647,278
23529,281
26623,307
34239,310
Edit by @PeterEllis - addition of illustrative plot showing the original fit

