(This question is related to a previous one I made, here)
I have a set of 2D observations (measured data) of sample size $N$:
$$O = \{(x_1, y_1), (x_2, y_2), ..., (x_N, y_N)\}$$
I also have a model $S(v_1, v_2, ..., v_p)$, which depends on $p$ parameters, and attempts to reproduce the observed data by generating artificial "observed" data.
The number of elements and spatial distribution of the artificial data generated with the model, depend on the values given to the $p$ parameters each time the model is used.
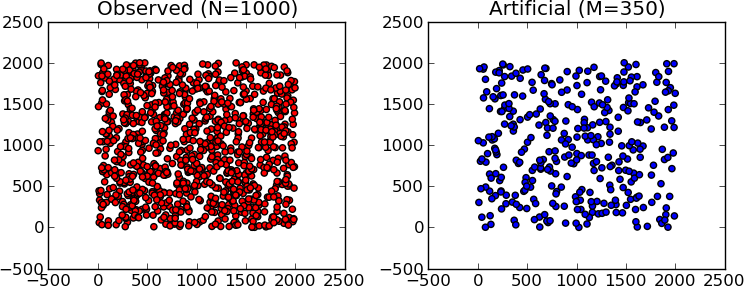
For example, here is some observed/measured data (left) of sample size $N=1000$, and some artificial data (right) of sample size $M=350$, obtained by fixing the $p$ parameters in $S$ to some values:

By varying the parameters of the model $S$, I generate $k$ sets of artificial data (each one uniquely described by the values assigned to the $p$ parameters) that I call $A_1, A_2, ..., A_k$, where:
$$A_r = \{(x_1, y_1), (x_2, y_2), ..., (x_{M_r}, y_{M_r})\}$$
(where the sets $A_1, A_2, ..., A_k$ have sample sizes $M_1, M_2, ..., M_k$)
I need to select from $A_1, A_2, ..., A_k$ the set that presents the best fit with my observed data $O$.
To do this I apply a log-likelihood test to each artificial data set:
$$L_r = -\sum_{i=1}^N \log ( \frac{1}{M_r} \sum_{j=1}^{M_r} e^{-\frac{(x_i - x_j)^2}{2}} e^{-\frac{(y_i - y_j)^2}{2}} )\;;\; r=1,..,k$$
where $(x_i, y_i)$ and $(x_j, y_j)$ represent observed and artificial data respectively.
As I understand it, I need to find the artificial set that minimizes the log-likelihood, and this will be the one that shows the best fit.
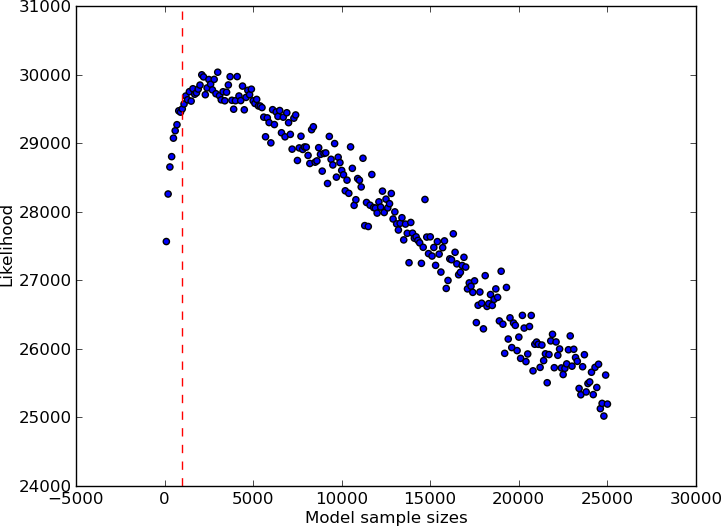
Something unusual (to me) happens with the likelihood values as the sizes of the artificial sets increase:

where each blue dot represents the log-likelihood value $L_r$ (y axis) obtained for an artificial set $A_r$ with sample size $M_r$ (x axis). The red line is the sample size for the observed data ($N=1000$).
Why is the log-likelihood small for artificial sets with few elements, climbs to a maximum and then starts dropping as the sample size of the artificial sets increase?
I would have expected the exact opposite behaviour, given that I am after the minimum log-likelihood value.
(The python code I used to generate these tests can be downloaded from here)
