0
$\begingroup$

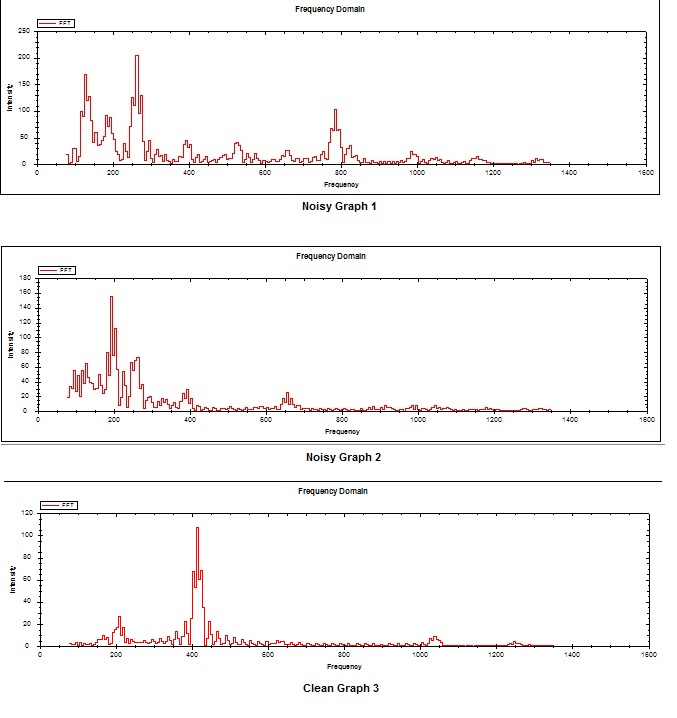
How do you do normalization so that when I get the mean/variance, the flat values wont affect the results? For example, in the figure below, Graph 1 & 2 are both considered to be noisy as compared to Graph 3.
enter image description here

However, as you can see, each of their flat intensity values vary from each other, so it could be possible that a 'clean' graph that contains very high intensity values can be considered 'noisy' as well as a 'noisy graph that contains low intensity values can be considered as 'clean'. I am using mean/variance and a threshold for determining if it is noisy or not, hence the need to 'normalize' the values.

Ive tried to do, getting the total and dividing each intensity to the total (e.g. arr[x] = arr[x] / total) but it does not work properly that way.

Any tips? Thanks!

$\endgroup$
2
  • 2
    $\begingroup$ Can you please define noisy? I don't see much difference between the three graphs. I would say that the frequency of the big events is maybe a tad lower in the 3rd, but I would not talk about noise. $\endgroup$
    – nico
    Commented Jul 5, 2011 at 13:26
  • $\begingroup$ Noisy are ones with generally many high peaks or spikes for that matter $\endgroup$
    – user488792
    Commented Jul 5, 2011 at 16:47

1 Answer 1

3
$\begingroup$

So if I understand correctly, you want to detect reliably whether a data sample has few high peaks as opposed to many low peaks? What I would do is sort your data by intensity, then determine (say) the 98th intensity percentile and the 90th intensity percentile and find the ratio between the two. For graph 3, the 98th intensity percentile should still be part of the peak and the 90th percentile deep in a valley so you get a big ratio. For 1 and 2, they should be much closer together, so you get a small ratio. Then play with the three numbers involved (the high percentile, the low percentile, and the threshold for the ratio) till it does something close to what you want on a training set.

$\endgroup$
1
  • $\begingroup$ Thanks! Yes, that is I think what I need (noisy have many peaks, clean have few peaks). Ill try what you suggested! Cheers! $\endgroup$
    – user488792
    Commented Jul 5, 2011 at 16:46

Your Answer

By clicking “Post Your Answer”, you agree to our terms of service and acknowledge you have read our privacy policy.

Not the answer you're looking for? Browse other questions tagged or ask your own question.