Quoting from one of the authors:
t-Distributed Stochastic Neighbor Embedding (t-SNE) is a (prize-winning) technique for dimensionality reduction that is particularly well suited for the visualization of high-dimensional datasets.
So it sounds pretty great, but that is the Author talking.
Another quote from the author (re: the aforementioned competition):
What have you taken away from this competition?
Always visualize your data first, before you start to train predictors on the data! Oftentimes, visualizations such as the ones I made provide insight into the data distribution that may help you in determining what types of prediction models to try.
Information must1 be being lost -- it is a dimensionality reduction technique afterall. However, as it is a good technique to use when visualising, the information lost is less valuable than the information highlighted (/made visible/comprehend-able through reduction to 2 or 3 dimensions).
So my question is:
- When is tSNE the wrong tool for the job?
- What kind of datasets cause it to not function,
- What kind of questions does it look like it can answer, but it actually can not?
- In the second quote above it is recommended to always visualise your dataset, should this visualisation always be done with tSNE?
I expect that this question might be best answered in the converse, ie answering: When is tSNE the right tool for the job?
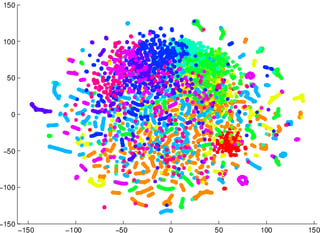
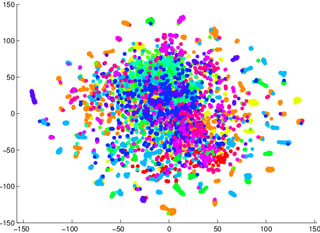
I have been cautioned not to rely on tSNE to tell me how easy data will be classifiable (separated into classes -- a discriminative model) The example of it being misleading was, that, for the two images below, a generative model2 was worse for the data visualised in the first/left (accuracy 53.6%) than an equivalent one for the second/right (accuracy 67.2%).


1 I could be wrong about this I may sit down and try at a proof/counter example later
2 note that a generative model is not the same as a discriminitive model, but this is the example I was given.
