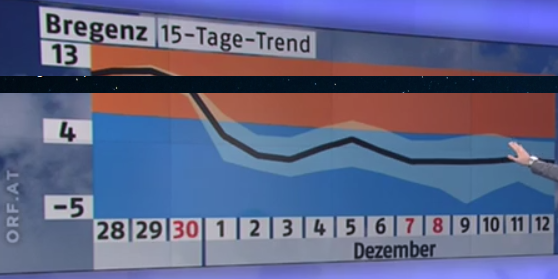
In Austrian television there is a weather show that gives temperature forecasts for the coming 15 days. They usually also provide uncertainty bands around that forecast which naturally makes the statisticians heart leap with joy. There is one thing that bothers me about it, though, and it is perfectly illustrated in this plot (sorry for the poor quality of the screenshot):

The screenshot was taken at November 27th. What it says is this is a 15 day trend from November 28th to December 12th. The black curve is the forecast and the wide bands are the uncertainty of that forecast (not further specified). Kindly direct your attention to December 9th and the December 11th, or December 5th and December 7th. One can see that the uncertainty band associated with the forecast that is further into the future is narrower than the forecast to the closer future.
This goes against what I believed to be one of few truths about forecasting, namely that a forecast of the far future should have higher uncertainty than a forecast to the near future.
The questions are therefore:
- Am I mistaken that forecasting the very same thing to the more distant future should be more uncertain than a forecast about the near future?*
- What are the conditions under which a forecast about the distant future is less uncertain than one about the near future.
- Do you know of any good examples where this actually happens (typical models or situations)?
*I'm not talking about forecasts that exceed a cumulative or natural boundary aspect to them. For example the uncertainty about the temperature in said city in 20 billion years will probably be close to 0 as the world will be dead by then. I think about events that basically don't have their conditions changed in such a manner.
