I am comparing expression of different genes involved in the same metabolic reaction of basil to two different conditions, exposure to cold Vs Infra-red light. I am in the process of analysing RNA seq data where I have genes that belong to different metabolic reactions such as lipid synthesis ,lipid degradation, sucrose synthesis, sucrose degradation, glycolysis, so on and so forth.
For each metabolic reaction I have a gene list in which genes are either upregulated or downregulated in both the conditions (cold or Infra-red light treatment).
Null hypothesis: There is no difference in basil's response when exposed to 24 hours of cold or Infra-red light.
Alternative hypothesis: There is a significant difference in basil's response to cold when compared to infra-red light treatment.
In order to test the difference between the treatments I am having to count the number of genes up or downregulated for each treatment and use the counts to create a 2x2 contingency table and then carry out a fishers exact test to establish a p value.
I thought it would be best to create a 2x2 contingency table in two formats.

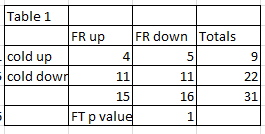
This table looks at the interactions between the two variables and thereby shows the overlapping pattern between the two treatments. However arrangement of my data in this manner does not show that there is a statistically significant difference between the two treatments.

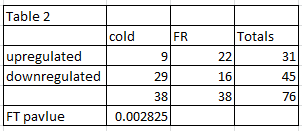
This table shows the exact comparisons that I would like to make and shows just what is happening in each treatment without directly showing any overlap between the two treatments (that I do not mind). The arrangement of data in this table also gives me a P value of less than 0.05 thereby it shows that there is a statistically significant difference between the two treatments. I am not sure however if the data arranged in the above table (Table 2)is valid as a 2x2 contingency table.
Please advise if the table 2 is appropriate enough to be used and to carry out a fishers exact test on?
