2
$\begingroup$

I'm trying to fit a sarima model on the univariate data with 180 points (periodicity=12). I use the auto.arima function in R. After fitting a model to the data, the only problem is the violation of the normality assumption. Then, I refit models after transforming the data but the residuals are still non-normal. For transformation of the data, I use both BoxCox.lambda (in forecast package) and boxcoxnc (in AID package) functions. Can anybody help me to fix this problem?

ser=c(1.887090e+04, -6.023007e+00,  1.193635e-02, -1.455856e-05,  1.064251e-08, -4.953592e-12,  1.517229e-15, -3.090332e-19,
4.137144e-23, -3.491891e-27,  1.682794e-31, -3.527046e-36,  1.904962e+04, -7.394189e+00,  1.600849e-02, -2.077511e-05,
1.585519e-08,-7.587987e-12,    2.363570e-15, -4.859251e-19,  6.534816e-23, -5.525202e-27,  2.663420e-31, -5.580438e-36,
2.009098e+04, -1.061082e+01,  2.319182e-02, -2.917768e-05,  2.171827e-08, -1.019917e-11,  3.133564e-15, -6.379905e-19,
8.520995e-23, -7.168462e-27,  3.442102e-31, -7.188143e-36,  2.067028e+04, -8.034999e+00,  1.761326e-02, -2.240562e-05,
1.680919e-08, -7.961614e-12,  2.469832e-15, -5.081494e-19,  6.861040e-23, -5.835236e-27,  2.831898e-31, -5.974519e-36,
2.233604e+04, -1.033148e+01,  2.287039e-02, -2.952031e-05,  2.255568e-08, -1.086351e-11,  3.419260e-15, -7.123005e-19,
9.720229e-23, -8.341734e-27,  4.079166e-31, -8.660882e-36,  2.392045e+04, -8.246481e+00,  1.585412e-02, -2.056180e-05,
1.636424e-08, -8.253437e-12,  2.710813e-15, -5.858824e-19,  8.245204e-23, -7.258003e-27,  3.624039e-31, -7.827743e-36,
2.636514e+04, -9.886355e+00,  1.951992e-02, -2.504930e-05,  1.963158e-08, -9.789139e-12,  3.190186e-15, -6.856046e-19,
9.606813e-23, -8.427664e-27,  4.196799e-31, -9.046539e-36,  2.866210e+04, -8.866902e+00,  1.734494e-02, -2.387617e-05,
1.957175e-08, -9.993900e-12,  3.300201e-15, -7.152619e-19,  1.008517e-22, -8.892694e-27,  4.448060e-31, -9.626143e-36,
3.002254e+04, -1.007403e+01,  2.151203e-02, -2.984675e-05,  2.427803e-08, -1.226036e-11,  3.997630e-15, -8.550747e-19,
1.190499e-22, -1.037815e-26,  5.140218e-31, -1.103334e-35,  2.929311e+04, -1.123255e+01,  2.282206e-02, -2.968240e-05,
2.323868e-08, -1.146069e-11,  3.677709e-15, -7.777557e-19,  1.073806e-22, -9.301478e-27,  4.584147e-31, -9.800725e-36,
3.306894e+04, -1.396117e+01,  2.326777e-02, -2.724425e-05,  2.023428e-08, -9.690231e-12,  3.055811e-15, -6.392630e-19,
8.763020e-23, -7.552202e-27,  3.707622e-31, -7.901994e-36,  3.491666e+04, -1.315883e+01,  2.554492e-02, -3.194439e-05,
2.437661e-08, -1.184053e-11,  3.762542e-15, -7.896499e-19,  1.082565e-22, -9.310722e-27,  4.554895e-31, -9.664092e-36,
3.775600e+04, -2.101521e+01,  4.695457e-02, -6.000206e-05,  4.510264e-08, -2.134088e-11,  6.600784e-15, -1.352465e-18,
1.817468e-22, -1.538166e-26,  7.429410e-31, -1.560507e-35,  3.699341e+04, -1.019327e+01,  1.761360e-02, -2.428662e-05,
2.084200e-08, -1.112473e-11,  3.796505e-15, -8.415154e-19,  1.204392e-22, -1.072641e-26,  5.402195e-31, -1.174885e-35,
4.009280e+04, -1.887174e+01,  3.441926e-02, -4.161190e-05,  3.152055e-08, -1.535050e-11,  4.911316e-15, -1.040003e-18,
1.440215e-22, -1.251900e-26,  6.190925e-31, -1.327693e-35)

require("forecast")
fit=auto.arima(ser,d = 0,D = 1,max.p = 6, max.q = 6,max.P = 6, max.Q = 6, max.order = 25,start.p=1, start.q=1, start.P=1, start.Q=1,stationary = FALSE,
seasonal=TRUE,stepwise=TRUE,trace=TRUE,approximation=FALSE,allowdrift=FALSE,ic="aicc")
$\endgroup$
6
  • $\begingroup$ The object ser is not defined correctly, the periodicity should be defined as follows: ser <- ts(ser, frequency = 12). $\endgroup$
    – javlacalle
    Commented Apr 26, 2015 at 14:54
  • $\begingroup$ 1) All the observations from the third to the twelfth season are zeros. This is the main source of non-normality. The Box-Cox transformation is not the way to deal with this situation. 2) What is the purpose of your analysis? forecasting, detecting a pattern,...? $\endgroup$
    – javlacalle
    Commented Apr 26, 2015 at 14:54
  • $\begingroup$ @javlacalle Thx for your reply. The data represent the evolution of coefficents of a 11th degree polynomial equation (in total 15 equations representing different years of electricity load duration curves). The purpose is to forecast the coefficients of e.g. the 16th equation and so the corresponding load duration curve. A model which fits the pattern with 5% MAPE can be found by R. I read some discusions about the violation of normality assumptions but they were not satisfying. Are there any methods to cope with this problem in R? Thx. $\endgroup$
    – Dirk
    Commented Apr 26, 2015 at 15:57
  • $\begingroup$ @javlacalle, setting coefficients with values near zero causes loss of information which can be seen during back testing when the equations are formed again. There is also problem with significance of VAR fitted models. Could there be another remedy or could one can just ignore the violation? I couldnt come to a conclusion. Do u have anaother suggestion? I found some info via this link: stats.stackexchange.com/questions/79400/… $\endgroup$
    – Dirk
    Commented Apr 28, 2015 at 11:58
  • $\begingroup$ If the MAPE suggests a good performance for forecasting compared to other alternatives, then you can ignore the fact that the residuals are not normally distributed. As the source of non-normality seems to be the large amounts of zeros, my idea was to leave aside the zeros (which show up in the same places all the time), so that they don't interfere in the process of fitting a model. $\endgroup$
    – javlacalle
    Commented Apr 28, 2015 at 18:47

1 Answer 1

2
$\begingroup$

You can stick to work with those coefficients that are not zero. An ARMA model can be fitted separately to each series of non-zero coefficients. As the value of each coefficient may affect each other, it may be better to fit a multivariate autoregressive model.

In R, this idea can be implemented as follows:

require("vars")
x <- ts(ser, frequency = 12)
# "mx" contains the value of each coefficient by columns
mx <- do.call("cbind", split(x, cycle(x)))
# fit VAR model of order 1
# (only for the first three coefficients as the others are zero)
fit <- VAR(mx[,1:3], p = 1, type = "const")
# compute and display forecasts for each coefficient
pred <- predict(fit, n.ahead = 4)
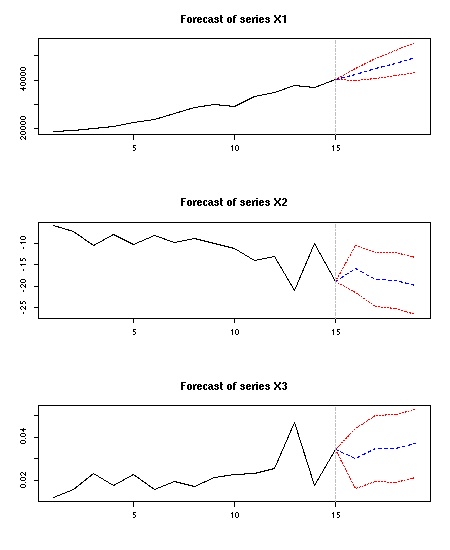
plot(pred)

forecasts for each series

The entire equation with the 12 coefficients can be reconstructed filling with zeros the remaining coefficients:

# reconstruct the series of forecasts filling with zeros the remaining coefficients
mp <- matrix(0, nrow = 4, ncol = 12)
mp[,1] <- pred$fcst[[1]][,"fcst"]
mp[,2] <- pred$fcst[[2]][,"fcst"]
mp[,3] <- pred$fcst[[3]][,"fcst"]
p <- ts(as.vector(t(mp)), frequency = 12, start = tail(time(x), 1) + 1/12)
round(p, 2)
# 16 42428.95   -16.02     0.03     0.00     0.00     0.00     0.00     0.00
# 17 44723.28   -18.38     0.03     0.00     0.00     0.00     0.00     0.00
# 18 46971.94   -18.67     0.03     0.00     0.00     0.00     0.00     0.00
# 19 49406.31   -19.94     0.04     0.00     0.00     0.00     0.00     0.00
plot(cbind(x, p), ylab = "", type = "n", plot.type = "single")
lines(x)
lines(p, col = "blue")
legend("topleft", legend = c("observed values", "forecasts"), lty = c(1,2),
  col = c("black", "blue"), bty = "n")

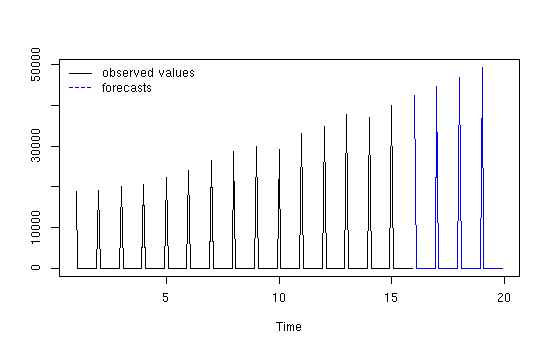
reconstructed series of forecasts

$\endgroup$
2
  • $\begingroup$ thx. The VAR fit brings the problem of insignificance of the estimates (only the first estimates are significant). I fitted also p=2, the problem of insignificance exists only for the variable X1 for first column values and the other columns are ok. But I dont think that the assumption of zero for the other columns will make things better. Because every coefficient in the 11th degree polynomial has a contribution to the curvature. I want to calculate MAPE for back testing but the total observation number is 15, the observation number is 14 and so the number of fitted values. $\endgroup$
    – Dirk
    Commented Apr 26, 2015 at 20:20
  • $\begingroup$ library(PolynomF),library(polynom) f1=as.function(as.polynomial( fit $varresult$ X1$ fitted.values)). This function I want to use for back testing for the first 12th entry, and then for the second 12th. But I think the best solution is going to be with a sarima model although the residuals are non-normally distributed. $\endgroup$
    – Dirk
    Commented Apr 26, 2015 at 20:25

Your Answer

By clicking “Post Your Answer”, you agree to our terms of service and acknowledge you have read our privacy policy.

Not the answer you're looking for? Browse other questions tagged or ask your own question.