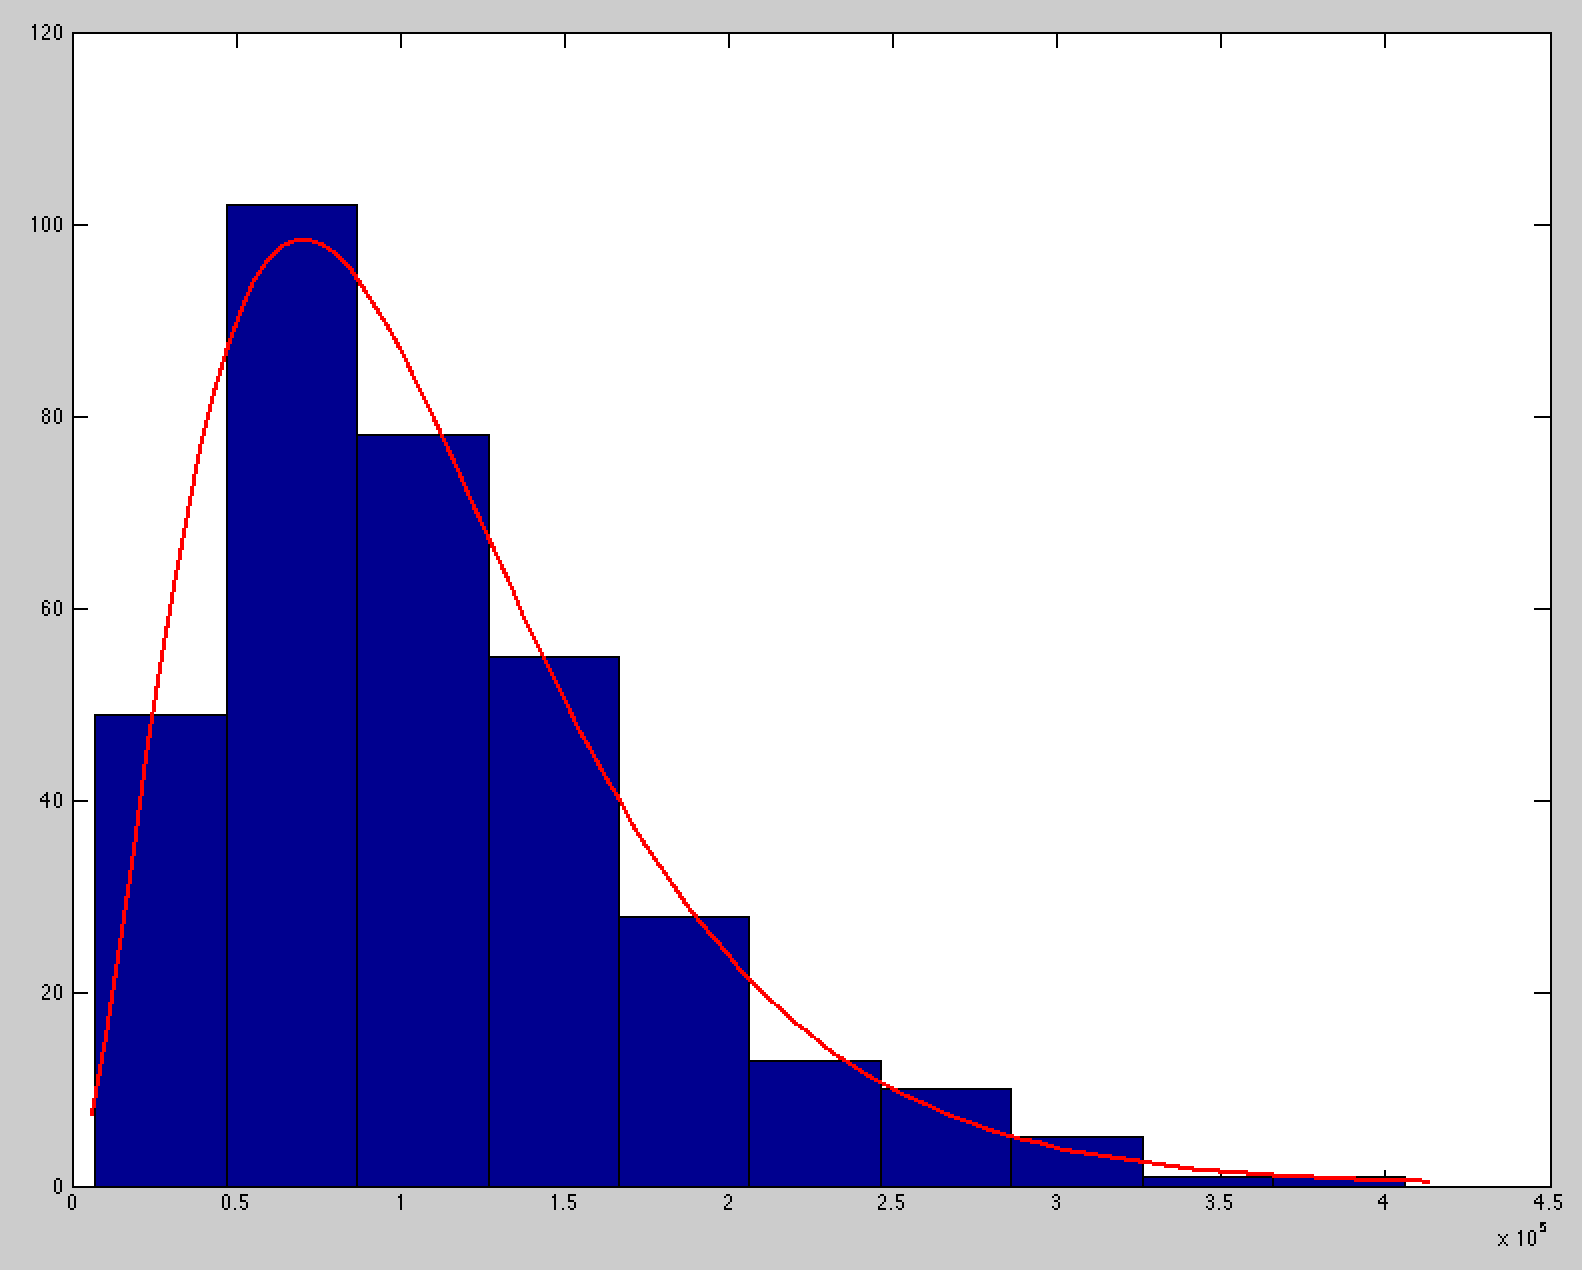
The system we are working on is biological, more specifically the distribution of specific events across a chromosome. This can be thought of as 1D array (the chromosome) across which points can be chosen (event positions). We have mapped the positions of these events experimentally and then calculated the inter-point distances (IPDs) (the distances between each successive event) - see below.

We have fitted a gamma-distribution to the calculated IPDs:

Gamma distribution
a = 2.7863
b = 39498.2
Which can be reconstructed separately using:
dist = gampdf(1:450000,2.7863,39498.2);
Question 1: I now want to convert this gamma distribution to a hazard function. Am I right in thinking that this will essentially plot out the probability of an event occurring at position x relative to an event at position 0?
To expand upon that, we have previously observed that our IPDs do not match those expected if event distributions across chromosomes were totally random. We are now working under the hypothesis that each event that occurs, creates a zone around it which makes it less likely another will occur nearby. By using a hazard function, we want to obtain measures of this reduction in probability at different distances.
Question 2: Could anybody provide the hazard function from this distribution so I know what I am aiming for? This is because I am having difficulty finding a way to do this on my chosen software and need to be able to check my output.
IPD data used to produce the gamma-distribution:
7126.5
11311.5
12582.25
13503
15588
18523.75
19287.75
20709.5
20761.5
21499
22153
22452
23112.5
24140
25429.25
25502.75
26399.75
26835.5
26951.25
27890.5
28876.5
29178.5
29447
31374.25
32463.5
32546.5
32848
33229.5
34460.5
35002.25
35545.25
37287.75
37498.75
37742.75
37881.5
38152
38888.25
38889
39059.25
39207.75
39483.5
42316.5
42516.75
43901.5
43923.5
44302
44611.25
45464
46433.5
47372.5
47929
48047.5
49677.5
50125.75
50528
50730.25
51460.5
51477.25
52397
55383.5
55563
56236.5
56455.75
57100.75
57363.5
57432.75
57785.25
58193.25
58429
58571
58760
58791.5
59372
59766.25
59831.5
59987.25
60087.75
60500.25
60565
60610.5
61444.75
61532.75
61640.5
62147.25
62208
62442
62912.25
63428.5
63508.25
63822.5
63849.5
64280.75
64497.75
65046
65113.25
65151.25
65691.5
66289.5
66672.25
67010
67030.75
67124
67573.75
68344
68969
69071.5
69680.75
70136
70228.25
70347.25
70733.5
70985
71448
71546.5
71912.75
71960.75
72532.75
73973.75
74258.5
74835
75124
75352.5
75487.5
76186.5
76710
78116.5
78206.5
78797
78918
79196.5
79722
79949.75
80091.5
80279
80727.75
80734.5
80816.5
81361.75
82155.75
82412.5
83397.25
84064.25
84225.25
84412.25
84469
84481
84665.25
84881.5
85289
85453.5
85483.25
87035.25
87686
87820.25
88464.75
88560
88808.5
88821
88862.25
89089.5
89631.75
90048
90234.75
90362.5
90453.25
90535.75
91369.25
92416.25
94617.75
94660.75
95887
96051.25
96294.25
96658
97369.75
98233.75
98573.25
98894.25
99009.5
99737
99811.75
100148.5
101425
103690.25
104260.5
104391.75
104459.5
105307.25
107394.25
107716.5
108504.25
108768
109578.5
109584.75
110242.75
110292.25
110687.5
110929.25
111462
112838.25
113079.5
113357.75
113566.25
113750.25
113848
114834.25
114871
114919.25
115591.25
115919.75
116756.25
116882
116888
116899.75
117400.75
119371
119740.5
120567.25
120958.25
121443.25
121452.25
122081.75
122628.25
123418.25
123595.25
124589.75
125306.25
126250.5
126396.75
126911.25
127730.25
128006.75
128296.5
128580.5
129565.25
130313.5
131147.5
131634
133562.25
133615.5
133937.25
134028.25
134362.25
134947.75
135474.5
136047.5
136651.25
137551
137577.5
139378.25
140254.5
140397.75
140836.5
141003.25
141719.5
142899.5
144318.5
144351
146389
146980.25
147244.25
148155
149128.25
149829.5
150237.5
150424.25
151113.5
153143
154442.75
154474.25
155433.25
157106.25
158005.75
158849.5
159248.75
160938.5
161086.75
161143.5
162161.5
163349
164672.75
164854.5
165023.25
166059.25
169018
170240.75
171916
172010
173273
173354
173550.5
175414.25
176046.5
176430.75
176779.75
177977.25
180548
180787.5
182136.75
182981.5
183180
184106
187303.5
190121.75
191309
192091.25
193096.25
197044
197481.25
197942.5
200061
203942
212572.5
212887
213560.75
213674.75
218347.25
219554.75
230242.25
231234
231270.75
231636.25
237084.75
240347.5
241466.75
248942.75
249088
253142.75
259002
259020.75
260244.75
260625.25
264837
273098.75
283252.75
287526.75
304071.75
304625.5
307101.5
307870.75
354267.5
405625.75
