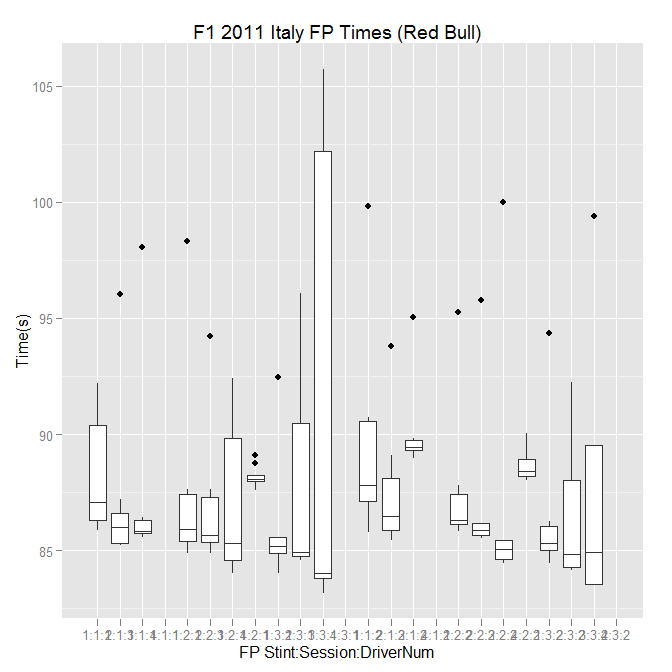
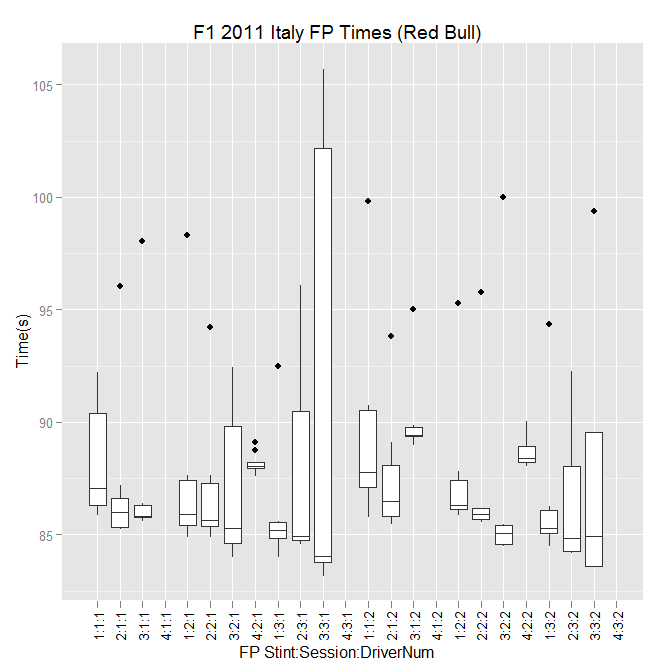
I have a function that plots (I think) various conditions within a set of motor racing timing data using boxplot:
library(RCurl)

gsqAPI = function(key, query, gid=0){
                  return(
                    read.csv( paste( sep="",'http://spreadsheets.google.com/tq?', 'tqx=out:csv','&tq=', curlEscape(query), '&key=', key, '&gid=', curlEscape(gid) ) )
                    ) }
pd=gsqAPI('0AmbQbL4Lrd61dHVNemlLLWNaZ1NzX3JhaS1DYURTZVE',
          'select A,C,E,G', gid='6')

boxplot(Time~Stint*Session*DriverNum,
        data=subset(pd, (DriverNum==1 | DriverNum==2)&Time<110),
        las=2, ylab="Time(s)", xlab="FP Stint:Session:DriverNum",
        ylim=c(80,110), main='F1 2011 Italy FP Times (Red Bull)')
What's the equivalent way of doing this using ggplot2? (That is, what's the ggplot2 equivalent of the boxplot command above?)
As a second part to the question, how would I generate a separate chart using ggplot2 that displays the boxplot overlaid with a plot of the raw data points within each condition?


