25
$\begingroup$

I would like to know how to transform negative values to log(), since I have heteroskedastic data. I've read that log(x+1) solves the problem but this doesn't work with my data and I continue getting NaNs as result.

For e.g. I get this warning message (I didn't put my complete database because I think one of my negative values is enough to show the problem):

> log(-1.27+1)
[1] NaN
Warning message:
In log(-1.27 + 1) : NaNs produced
> 

UPDATE:

Here is an histogram of my data. I'm working with palaeontological time series of chemical measurements. If the difference between (for e.g.) variables like Ca and Zn is too big, I need some type of data standardization, which is why I'm testing the log() function.
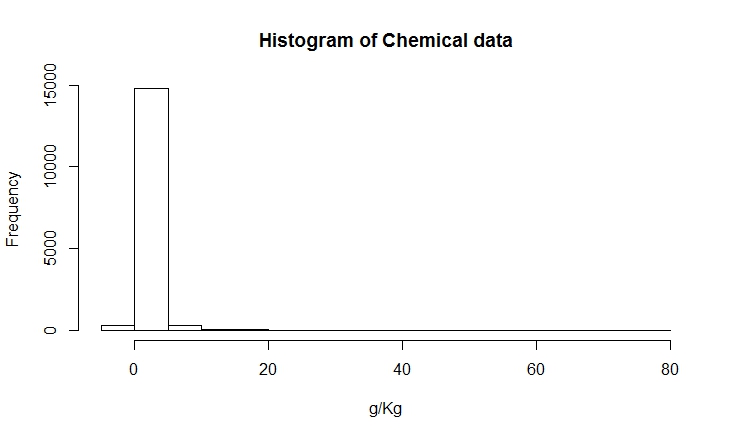
enter image description here

This is my raw data

$\endgroup$
19
  • 2
    $\begingroup$ The logarithm is only defined for positive numbers, and is usually used as a statistical transformation on positive data so that a model will preserve this positiveness. The log(x+1) transformation will is only defined for x > -1, as then x + 1 is positive. It'd be good to know your reason for wanting to log transform your data. $\endgroup$ Commented Jun 4, 2015 at 4:58
  • 4
    $\begingroup$ Tell us more about the data, including the range, mean, frequencies of negative, zero and positive values. It could be that a generalized linear model with log link makes most sense for the data so long as it is reasonable to think that the mean response is positive. It could be that you should not be transforming at all. $\endgroup$
    – Nick Cox
    Commented Jun 4, 2015 at 6:34
  • 10
    $\begingroup$ Thanks for adding details. For such data 0 has a meaning (equality!) that should be respected, indeed preserved. For that and other reasons I would use cube roots. In practice, you will need some variation on sign(x) * (abs(x))^(1/3), the details depending on software syntax. For more on cube roots see e.g. stata-journal.com/sjpdf.html?articlenum=st0223 (see esp. pp.152-3).We used cube roots to help visualization of a response variable that can be positive and negative in nature.com/nature/journal/v500/n7464/full/… $\endgroup$
    – Nick Cox
    Commented Jun 4, 2015 at 7:54
  • 9
    $\begingroup$ Why aren't you transforming the original variables instead of the differences? $\endgroup$
    – whuber
    Commented Jun 4, 2015 at 8:23
  • 5
    $\begingroup$ You solved the mathematical problem. @whuber's suggestion or cube roots would still, I think, be easier to work with, especially if the constant is purely empirical or varies between variables. A good rule for choice of transformations is only to use transformations that would work for similar data you can imagine. Thus $\log(x + 4)$ "works" for $x > -4$ but would fail if your next batch was bounded by $-5$.. $\endgroup$
    – Nick Cox
    Commented Jun 6, 2015 at 7:00

2 Answers 2

16
$\begingroup$

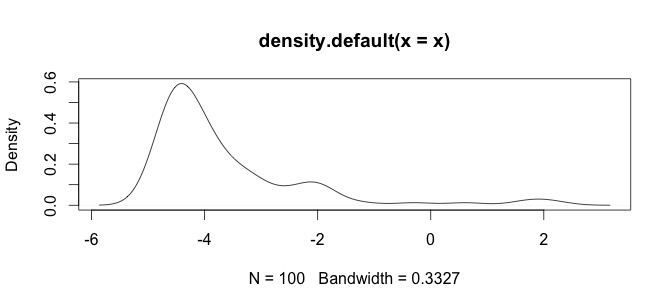
Since logarithm is only defined for positive numbers, you can't take the logarithm of negative values. However, if you are aiming at obtaining a better distribution for your data, you can apply the following transformation.

Suppose you have skewed negative data:

x <- rlnorm(n = 1e2, meanlog = 0, sdlog = 1)
x <- x - 5
plot(density(x))

then you can apply a first transformation to make your data lie in $(-1,1)$:

z <- (x - min(x)) / (max(x) - min(x)) * 2 - 1
z <- z[-min(z)]
z <- z[-max(z)]
min(z); max(z)

and finally apply the inverse hyperbolic tangent:

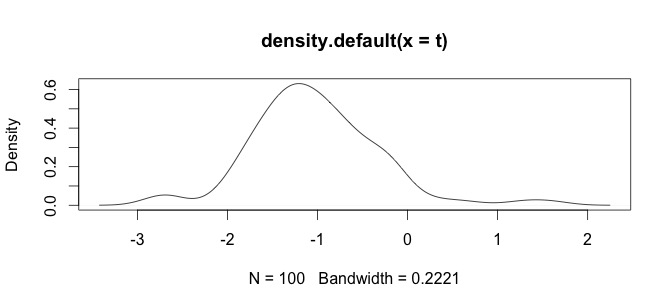
t <- atanh(z)
plot(density(t))

Now, your data look approximately normally distributed. This is also called Fisher transformation.

$\endgroup$
6
  • 13
    $\begingroup$ You solved the immediate mathematical problem. But I don't think most likely consumers of statistical results would find it easy to think about $\text{atanh}[(x - \min(x)) / (\max(x) - \min(x))]$ as a response scale and in modelling you would need to think what error structure makes sense.The scale would be sensitive to the empirical minimum and maximum. $\endgroup$
    – Nick Cox
    Commented Jun 4, 2015 at 6:38
  • 3
    $\begingroup$ @NickCox You are absolutely right. Maybe if the OP add more details about his problem, we could figure out an alternative solution! $\endgroup$ Commented Jun 4, 2015 at 6:43
  • $\begingroup$ The inner argument in my first comment is not what is being transformed, but the spirit of my comment is I think unaffected. $\endgroup$
    – Nick Cox
    Commented Jun 4, 2015 at 8:35
  • 1
    $\begingroup$ The statements z <- z[-max(z)] and z <- z[-min(z)] inappropriately shrink z down to a single value. Also the general function atanh(((x - min(x)) / (max(x) - min(x)))) produces Inf for the minimum and maximum values of x. $\endgroup$
    – Max Ghenis
    Commented Aug 7, 2018 at 19:39
  • 4
    $\begingroup$ Despite the large number of upvotes, this seems to me a poor solution, as (1) it is going to be hard, even impossible, to compare results with other datasets with different minimum and maximum (2) the transformation therefore does not respect sign of the original, which is both possible and preferable (3) atanh() is not widely familiar (or intuitive, as people are wont to say) Use sign(y) log(1 + y) or the cube root or asinh(). Note that Fisher transformation is a respected, respectable solution if the distribution is already bounded by [-1, 1], as is true of sample correlations. $\endgroup$
    – Nick Cox
    Commented Sep 27, 2022 at 9:57
12
$\begingroup$

This has been covered in detail in the comments, but there still isn't an answer stating this. So for the benefit of future readers:

Please DON'T fiddle with your negative values (especially differences!) so that you can apply a log transformation. Strategies such as adding constants introduce bias; this can work out alright if done with care but can also lead to completely incorrect and uninterpretable results. See this thread for more detail about this: Interpreting log-log regression with log(1+x) as independent variable.

Instead, use a transformation that handles negative values naturally. The cube root transformation is an obvious candidate here, as it is simple, easier to interpret than complex options such as rescaled inverse hyperbolic tangents, and has the advantage that the interesting and special case of 0 is preserved.

As Nick Cox mentions, you will need to implement this carefully yourself because just raising your values to the power of 1/3 will not work in R. Instead, you'll need something like sign(x) * (abs(x))^(1/3).

More generally, it's best to think carefully about the nature of the data and the goal of the analysis while deciding on a transformation, and not letting canned procedures guide how you handle the data.

$\endgroup$
1
  • 1
    $\begingroup$ this is a perfect solution, thank you. I see people add a +1 ALL.the.time and its been working for me so far until it didn't. I was running a linear model with a covariate and wanted to visual the data and this was the only transformation that worked under all conditions including ones with big outliers. $\endgroup$
    – Ahdee
    Commented Sep 22, 2022 at 22:22

Your Answer

By clicking “Post Your Answer”, you agree to our terms of service and acknowledge you have read our privacy policy.

Not the answer you're looking for? Browse other questions tagged or ask your own question.