I need to model demand for server components. Server 1 & Server 2 both use Hard Drive B, Server 1 uses Network Card A, and Server 2 uses Network Card C.
Server 1     Server 2
    |           |
  --------------------
  |          |       |
NC A       HD B     NC C
Or, in a linear algebra representation:
$ \begin{bmatrix} S_1 \\ S_2 \\ Pt_A \\ Pt_B \\ Pt_C \\ \end{bmatrix} = \begin{bmatrix} 1 & 1 & 0 \\ 0 & 1 & 1 \\ 1 & 0 & 0 \\ 0 & 1 & 0 \\ 0 & 0 & 1 \end{bmatrix} \begin{bmatrix} Pt_A \\ Pt_B \\ Pt_C \\ \end{bmatrix} $
Currently, we're forecasting server-level and component-level demand separately. How can I forecast the components, using the server-level history as well as the component-level history? I think it's more complicated than your typical vector autoregression or even your typical hierarchical time series.
I'm trying to think about how to model this using Rob Hyndman's forecast package in R. This might be getting out of Cross Validated territory, but here's what I have:
Y = data.frame(Y1=c(10,12,6,4), Y2=c(4,18,22,32))
P = data.frame(A=c(10,12,6,4), B=c(14,30,28,36), C=c(4,18,22,32))

comb <- cbind(Y,P)
nodes <- list(2, c(3,2))
out <- hts(comb, nodes)

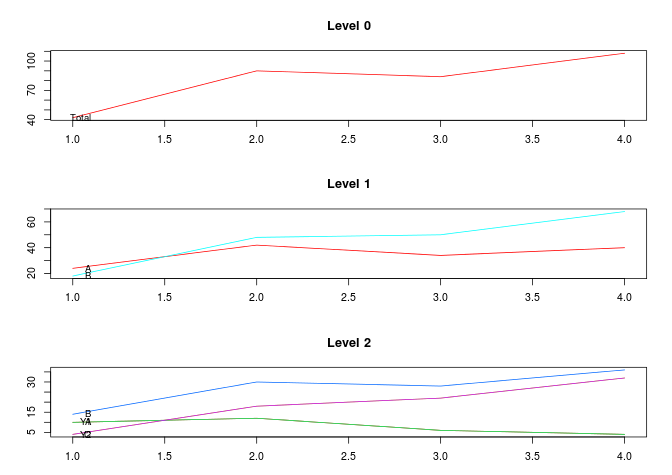
plot(out)

Assuming that there's nothing egregiously wrong with that setup, it seems like it's forecasting both servers (Y1 & Y2) together, which isn't something I necessarily want to do.
