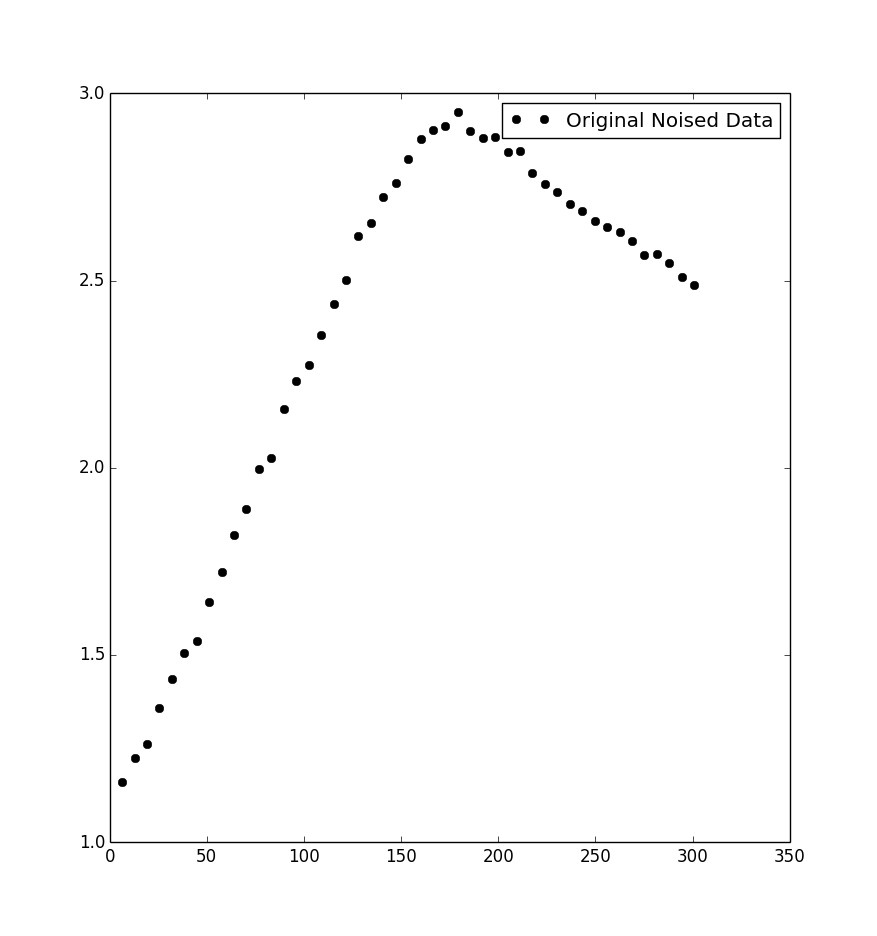
I have data that looks somewhat like the following plot (and dataset). It's been suggested that a double exponential (e.g. k (exp(−αt) − exp(−βt))) might fit it, but I can seem to get it to fit (using numpy).
It looked to me like the data descends too quickly to be modeled by the double exponential.
So, my question is can a double exponential model this? What equation might better model the data? Any other advise is most welcome.

x-coordinates:   1.0   6.4  12.8  19.2  25.6  32.0  38.4  44.8  51.2  57.6  64.0  70.4  76.8  83.2  89.6  96.0 102.4 108.8 115.2 121.6 128.0 134.4 140.8 147.2 153.6 160.0 166.4 172.8 179.2 185.6 192.0 198.4 204.8 211.2 217.6 224.0 230.4 236.8 243.2 249.6 256.0 262.4 268.8 275.2 281.6 288.0 294.4 300.8
y-coordinates:  1.11480 1.16038 1.22538 1.26349 1.36004 1.43608 1.50585 1.53842 1.64206 1.72283 1.82148 1.89048 1.99732 2.02578 2.15737 2.23078 2.27603 2.35556 2.43753 2.50104 2.61819 2.65381 2.72461 2.76175 2.82420 2.87889 2.90351 2.91266 2.94975 2.89997 2.88127 2.88341 2.84234 2.84720 2.78705 2.75804 2.73560 2.70544 2.68594 2.65800 2.64314 2.62951 2.60664 2.56948 2.57086 2.54823 2.50936 2.48867
Original data is here: http://pastebin.com/0x641He3
