2
$\begingroup$

I have data that follows a very obvious trend but I am failing to find the right function to fit the data. I've tried a logistic as well as an exponential function. However, both functions do not seem to fit the data very well given how clean they look. enter image description here
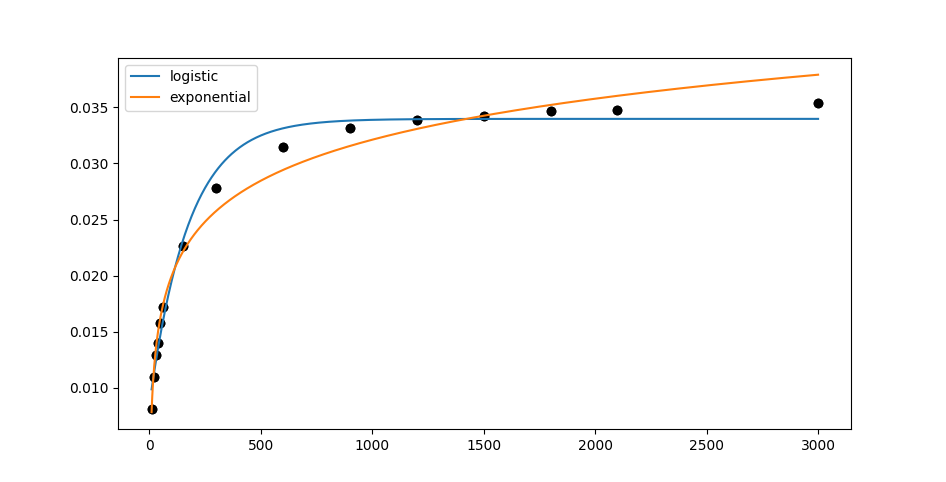
Below is the Python code to reproduce the plot - what kind of function would provide a better fit?

import numpy as np
from matplotlib import pyplot as plt
from scipy.optimize import curve_fit

y = np.array([0.00814809, 0.01093976, 0.01294903, 0.01403736,
              0.01579931, 0.0171861 , 0.02268682, 0.02785176,
              0.03149701, 0.03315134, 0.03389025, 0.03420652,
              0.03465968, 0.03477675, 0.03535143])

x = np.array([10, 20, 30, 40, 50, 60, 150, 300, 600,
           900, 1200, 1500, 1800, 2100,3000])

def logistic(x, L, x0, k, b):
    y = L / (1 + np.exp(-k * (x - x0))) + b
    return y
 
def exponential(x, a, b, c):
    return a * x**b + c

plt.scatter(x, y, color="black")
xrange = np.linspace(x.min(), x.max(), 1000)

# fit a logistic function
popt, pcov = curve_fit(logistic, x, y, method="dogbox", maxfev=20000)
plt.plot(xrange, logistic(xrange, popt[0], popt[1], popt[2], popt[3]), label="logistic")

# fit an exponential function
popt, pcov = curve_fit(exponential, x, y, maxfev=10000)
plt.plot(xrange, exponential(xrange, popt[0], popt[1], popt[2]), label="exponential")

plt.legend()
plt.show()
$\endgroup$
10
  • 1
    $\begingroup$ "Predictive accuracy" is usually measured in terms of an error and grows smaller as the amount of training data increases. Your numbers don't do that, so please tell us how they are computed. $\endgroup$
    – whuber
    Commented Oct 27, 2022 at 21:36
  • 2
  • 2
    $\begingroup$ It's certainly quite possible to choose simple-ish functions that get close to those points, but beware function-hunting; it's better to use understanding of the variables and the way they should relate in this situation to inform the model than just find something that 'fits'. (That's a by-eye fit, not any attempt to optimize coefficients or anything, since it's largely just there to illustrate that it's doable, but not necessarily useful.) $\endgroup$
    – Glen_b
    Commented Oct 27, 2022 at 23:17
  • 3
    $\begingroup$ It's very important to think about the purpose for which you need this function. e.g. if you're mostly trying to interpolate other values within the range of the data, identifying an explicit parametric function is not necessary - a suitable spline fit should work just fine for that (though a simple transformation of the variables might make it a little easier). If the aim is to extrapolate beyond x=3000, function-hunting is particularly dangerous. ... $\endgroup$
    – Glen_b
    Commented Oct 27, 2022 at 23:38
  • 1
    $\begingroup$ That was a fair while back now. To my recollection I did a by-eye identification of an approximate upper bound on y (erring a tad on the high side), did a logit type transformation of y and a log transformation on x to get very rough linearity and then backed out an approximate y=f(x) curve from that. It would not be responsible to use that function to try to identify/compare the size and location of major features, since it's an inadequate description of the curve. I see no reason why things like inflexion points couldn't be taken from spline fits. $\endgroup$
    – Glen_b
    Commented Oct 29, 2022 at 0:22

1 Answer 1

4
$\begingroup$

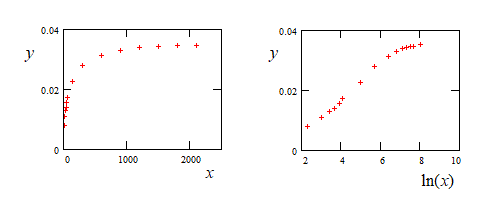
A preliminary inspection consists in ploting the data with various scales. For example :

enter image description here

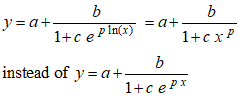
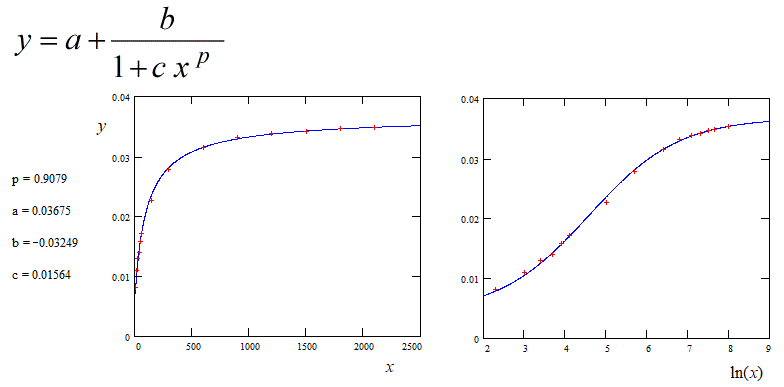
We observe that the curve with ln(x) on the horizontal axis looks like a logistic curve. So, we try a logistic regression but with ln(x) instead of x.

enter image description here

The result is :

enter image description here

I agree with most of the comments to obi's question and I upvoted several.

$\endgroup$
3
  • 1
    $\begingroup$ The OP seems to have tacitly assumed linearity in the predictor (linearity inside the logistic function). A natural approach it seems to me would have been to use a regression spline in the predictor up front. $\endgroup$ Commented Oct 30, 2022 at 12:33
  • $\begingroup$ Thank you, I also ended up doing the log-tranform you suggested. @Frank, could you elaborate what you mean by using a regression spline in the predictor? $\endgroup$
    – obi
    Commented Oct 31, 2022 at 18:32
  • $\begingroup$ Details are in my RMS course notes. $\endgroup$ Commented Oct 31, 2022 at 19:35

Your Answer

By clicking “Post Your Answer”, you agree to our terms of service and acknowledge you have read our privacy policy.

Not the answer you're looking for? Browse other questions tagged or ask your own question.