2
$\begingroup$

I'm doing a project about dilated kidneys, these can be arranged into mild, moderate and severe. There are 53 patients in total. I want to see if there is a trend in the severity of dilatation between those that have an 'adverse outcome' (like surgery, scarring etc) and those who do not.

Here is my data:

              mild(1)       mod(2)     severe(3)       Total

Adverse outcome ---0---------------- 4-----------------5--------------------9

No adverse outcome-28--------------10---------------- 6------------------ 44

Total----------------------28--------------14---------------11----------------- 53

Now, i realise these numbers are fairly small. I am new to statistics and initially tried a chi-square test for linear trend using software which came out as P=0.0003. However on reflection, the data values in some of the boxes are very low (and one is zero!) - do the same minimum values apply for chi-square for linear trend as with pearsons chi-square? ie 80% expected values should be above or equal to 5. Nothing online seems to mention any particular threshold for chi-squared for trend.

If i cannot use this test, please could you let me know of an alternative ASAP? thanks a lot!

$\endgroup$
1
  • $\begingroup$ It's worth noting that the guidelines surrounding minimum values you mention refer to the expected values in the cell, not the observed values. $\endgroup$ Commented Mar 29, 2017 at 14:47

1 Answer 1

2
$\begingroup$

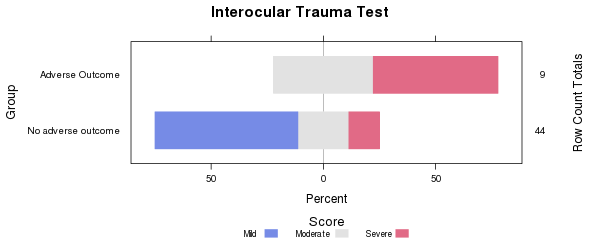
For your data, I would use the IOT (Interocular Trauma Test – the results are obviously statistically significant):

Graphical representation of the data

But in general, if you want a proper statistical test, I recommend the Wilcoxon–Mann–Whitney test. It’s based on the following idea: If you choose a random ‘adverse outcome patient’ and a random ‘non-adverse outcome’ patient, what’s the probability that that the ‘adverse’ patient will have the most severe dilatation. The null hypothesis is that this probability is 50%.

Here’s some R code to perform the (two-sided version of the) test:

> adv = rep(1:3, times=c(0,4,5))
> no_adv = rep(1:3, times=c(28,10,6))
> 
> library(exactRankTests)
> wilcox.exact(adv, no_adv)

    Exact Wilcoxon rank sum test

data:  adv and no_adv
W = 337, p-value = 0.0001798
alternative hypothesis: true mu is not equal to 0

Since you have lots of ‘ties’, I used the exact version of the test.

But really, you have so much data, at least in one of the groups, that even an ordinary Welch’s t-test would work well. (Note that it’s important that it’s the ‘Welch’ version, which doesn’t assume equal variance in the two groups.) For comparison, it gives a p-value of 0.00013.

For summarising the data, you might consider the concordance measure, the c-index, sometimes known as the AUC. (See my explanation on how to how to interpret and calculate it, which includes a couple of graphical representations.)

$\endgroup$
2
  • $\begingroup$ Hi - thank you so much for your response! I am trying to enter my data into 'statsdirect', the software that we have available to use, in order to replicate what you have done (as i have other similar data i need to find trends for). i can either select mann-whitney test or wilcoxon signed rank tests - i assume it is wilcoxon? through this, it asks me to 'select 2 matched columns' - i am unclear as to how i can fit my data into 2 matched columns? i selected my data arranged as above and it came up with '2-sided p=0.25'? please excuse my confusion, I'm not very comfortable with stats! thanks! $\endgroup$
    – nicole
    Commented Jul 12, 2015 at 19:34
  • $\begingroup$ I'm not certain a t-test would be the best choice given the data however. It is ordinal data which I would strongly suspect does not have equal intervals. Nicole, the test described above goes by various names unfortunately (See en.wikipedia.org/wiki/Mann%E2%80%93Whitney_U_test). It does not seem like your data is matched either (i.e., related or repeated samples) since each person either had or did not have an adverse event. You want the Mann-Whitney U test. $\endgroup$ Commented Mar 29, 2017 at 15:06

Your Answer

By clicking “Post Your Answer”, you agree to our terms of service and acknowledge you have read our privacy policy.

Not the answer you're looking for? Browse other questions tagged or ask your own question.