10
$\begingroup$

In my field the usual way to plot paired data is as a series of thin sloping line segments, overlaying it with the median and CI of the median for the two groups:
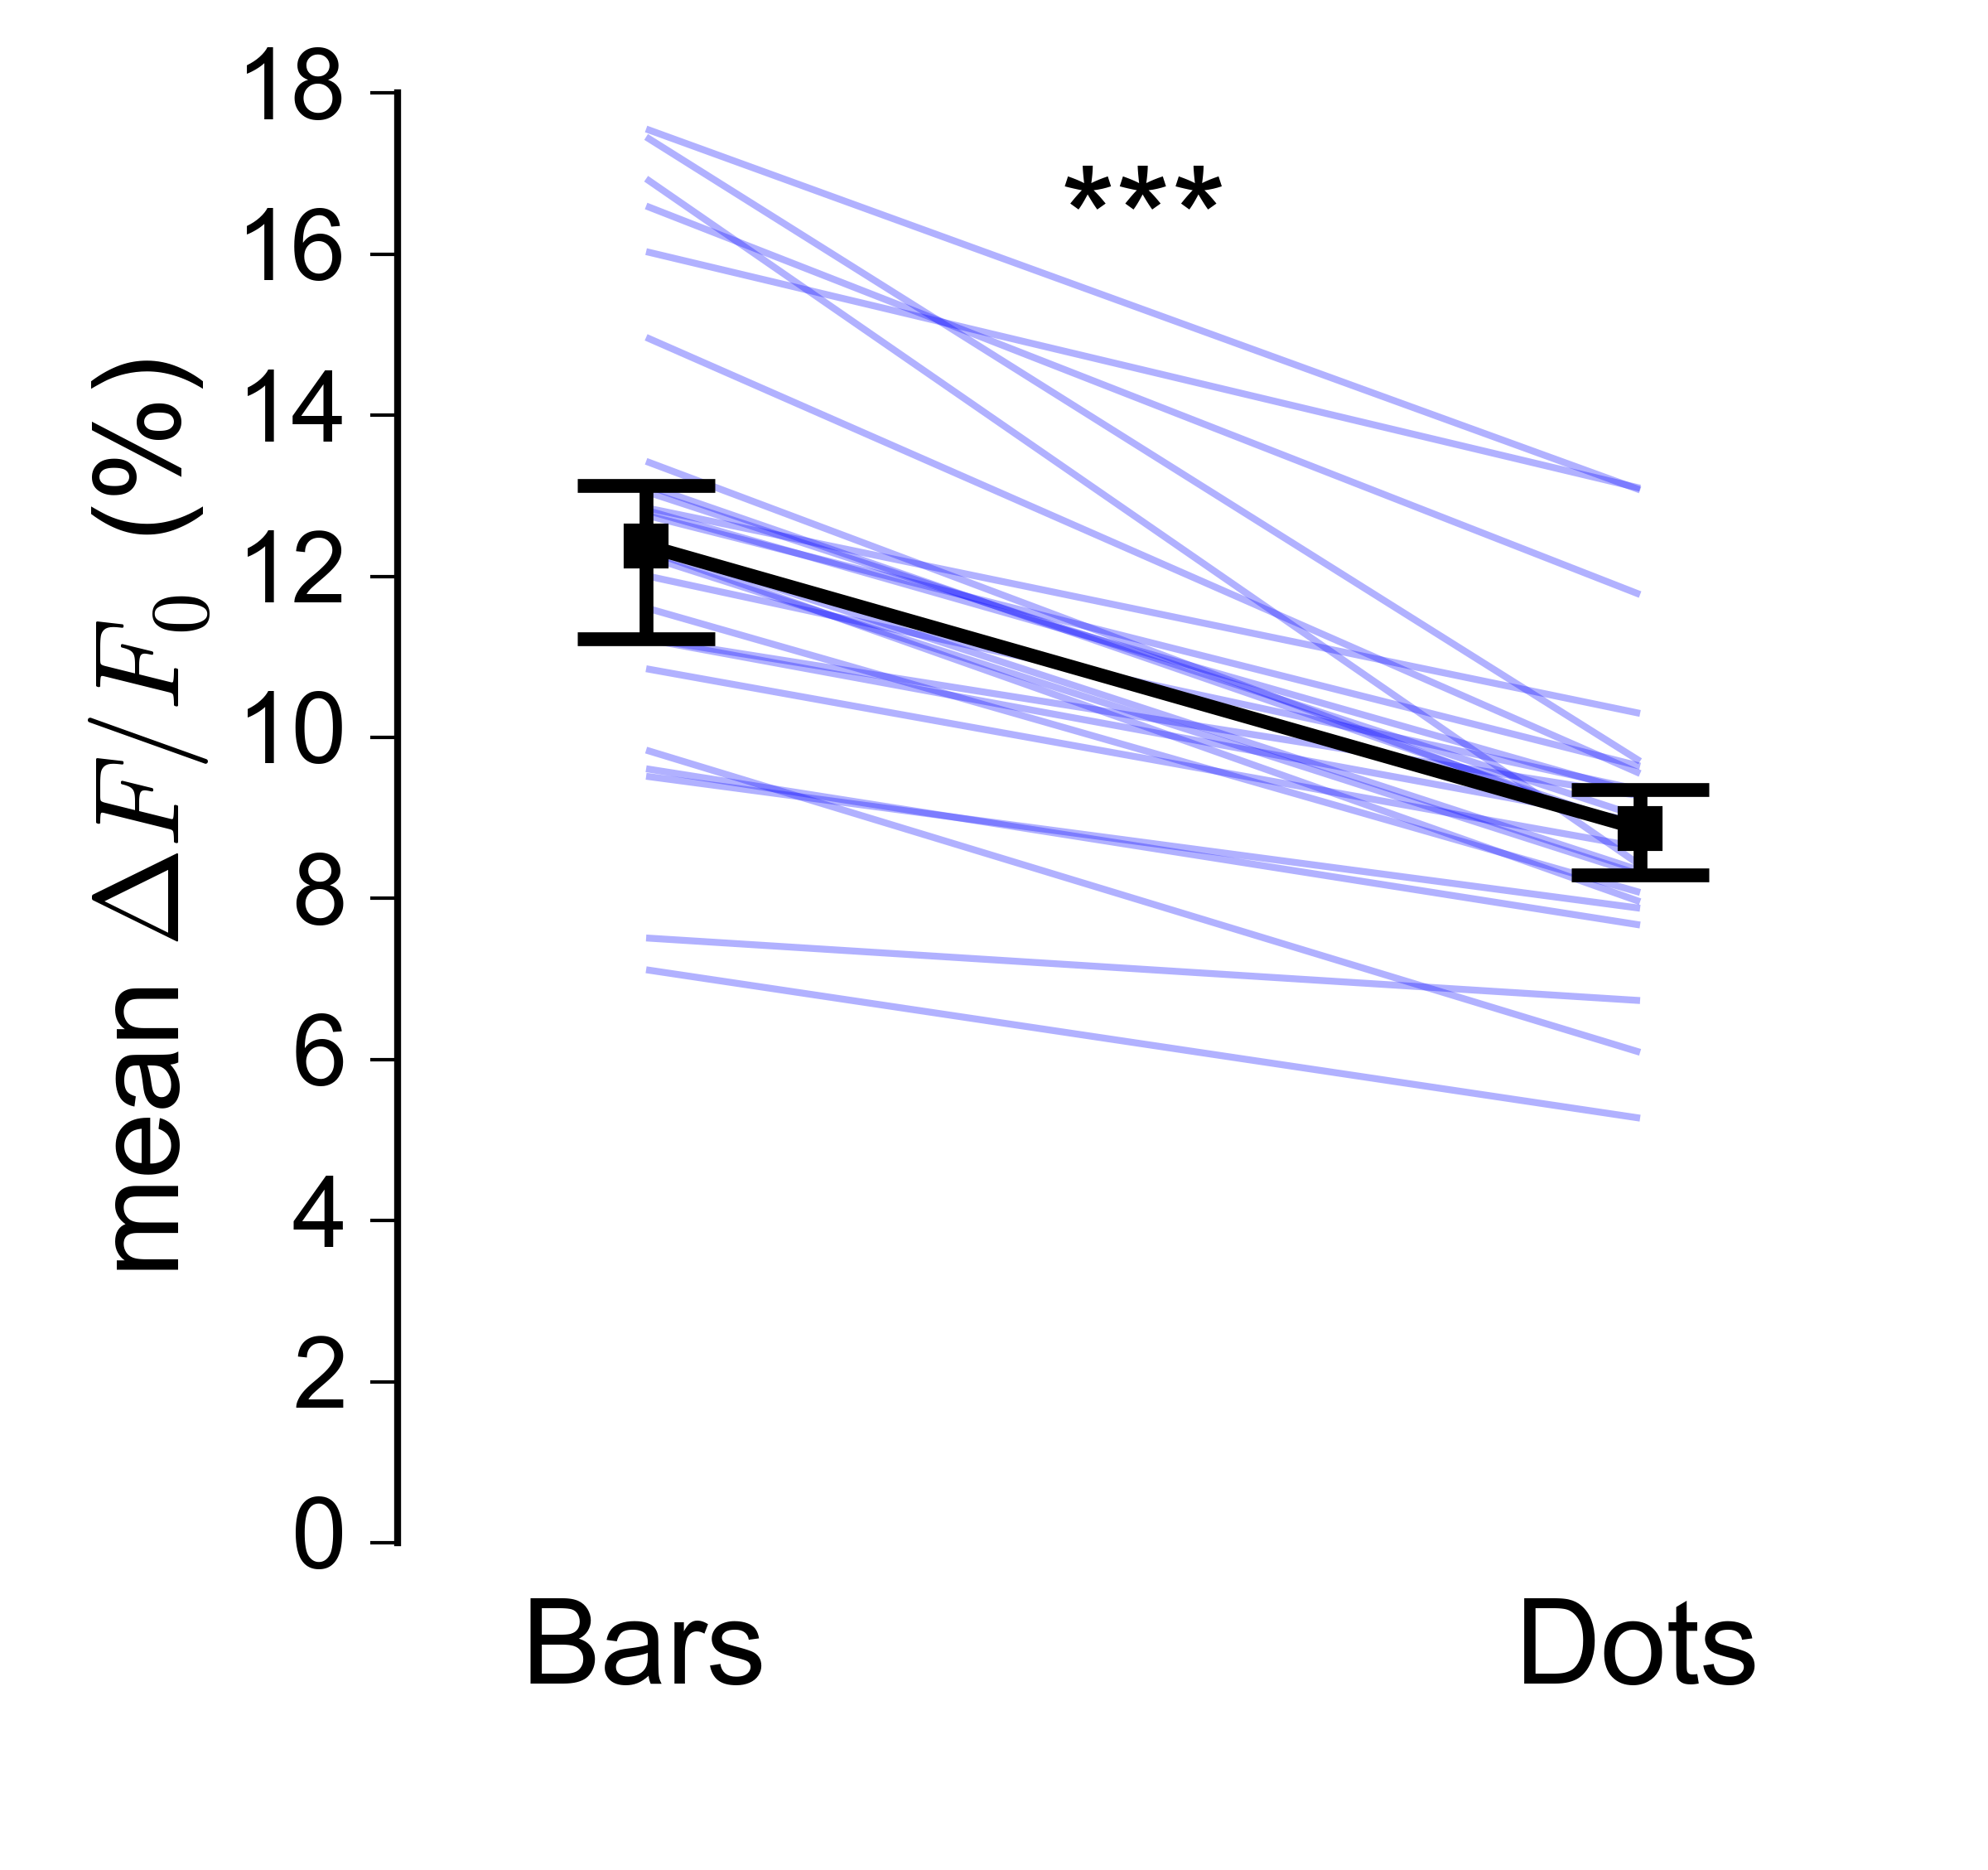
enter image description here

However, this sort of plot becomes much harder to read as the number of datapoints gets very large (in my case I have on the order of 10000 pairs):
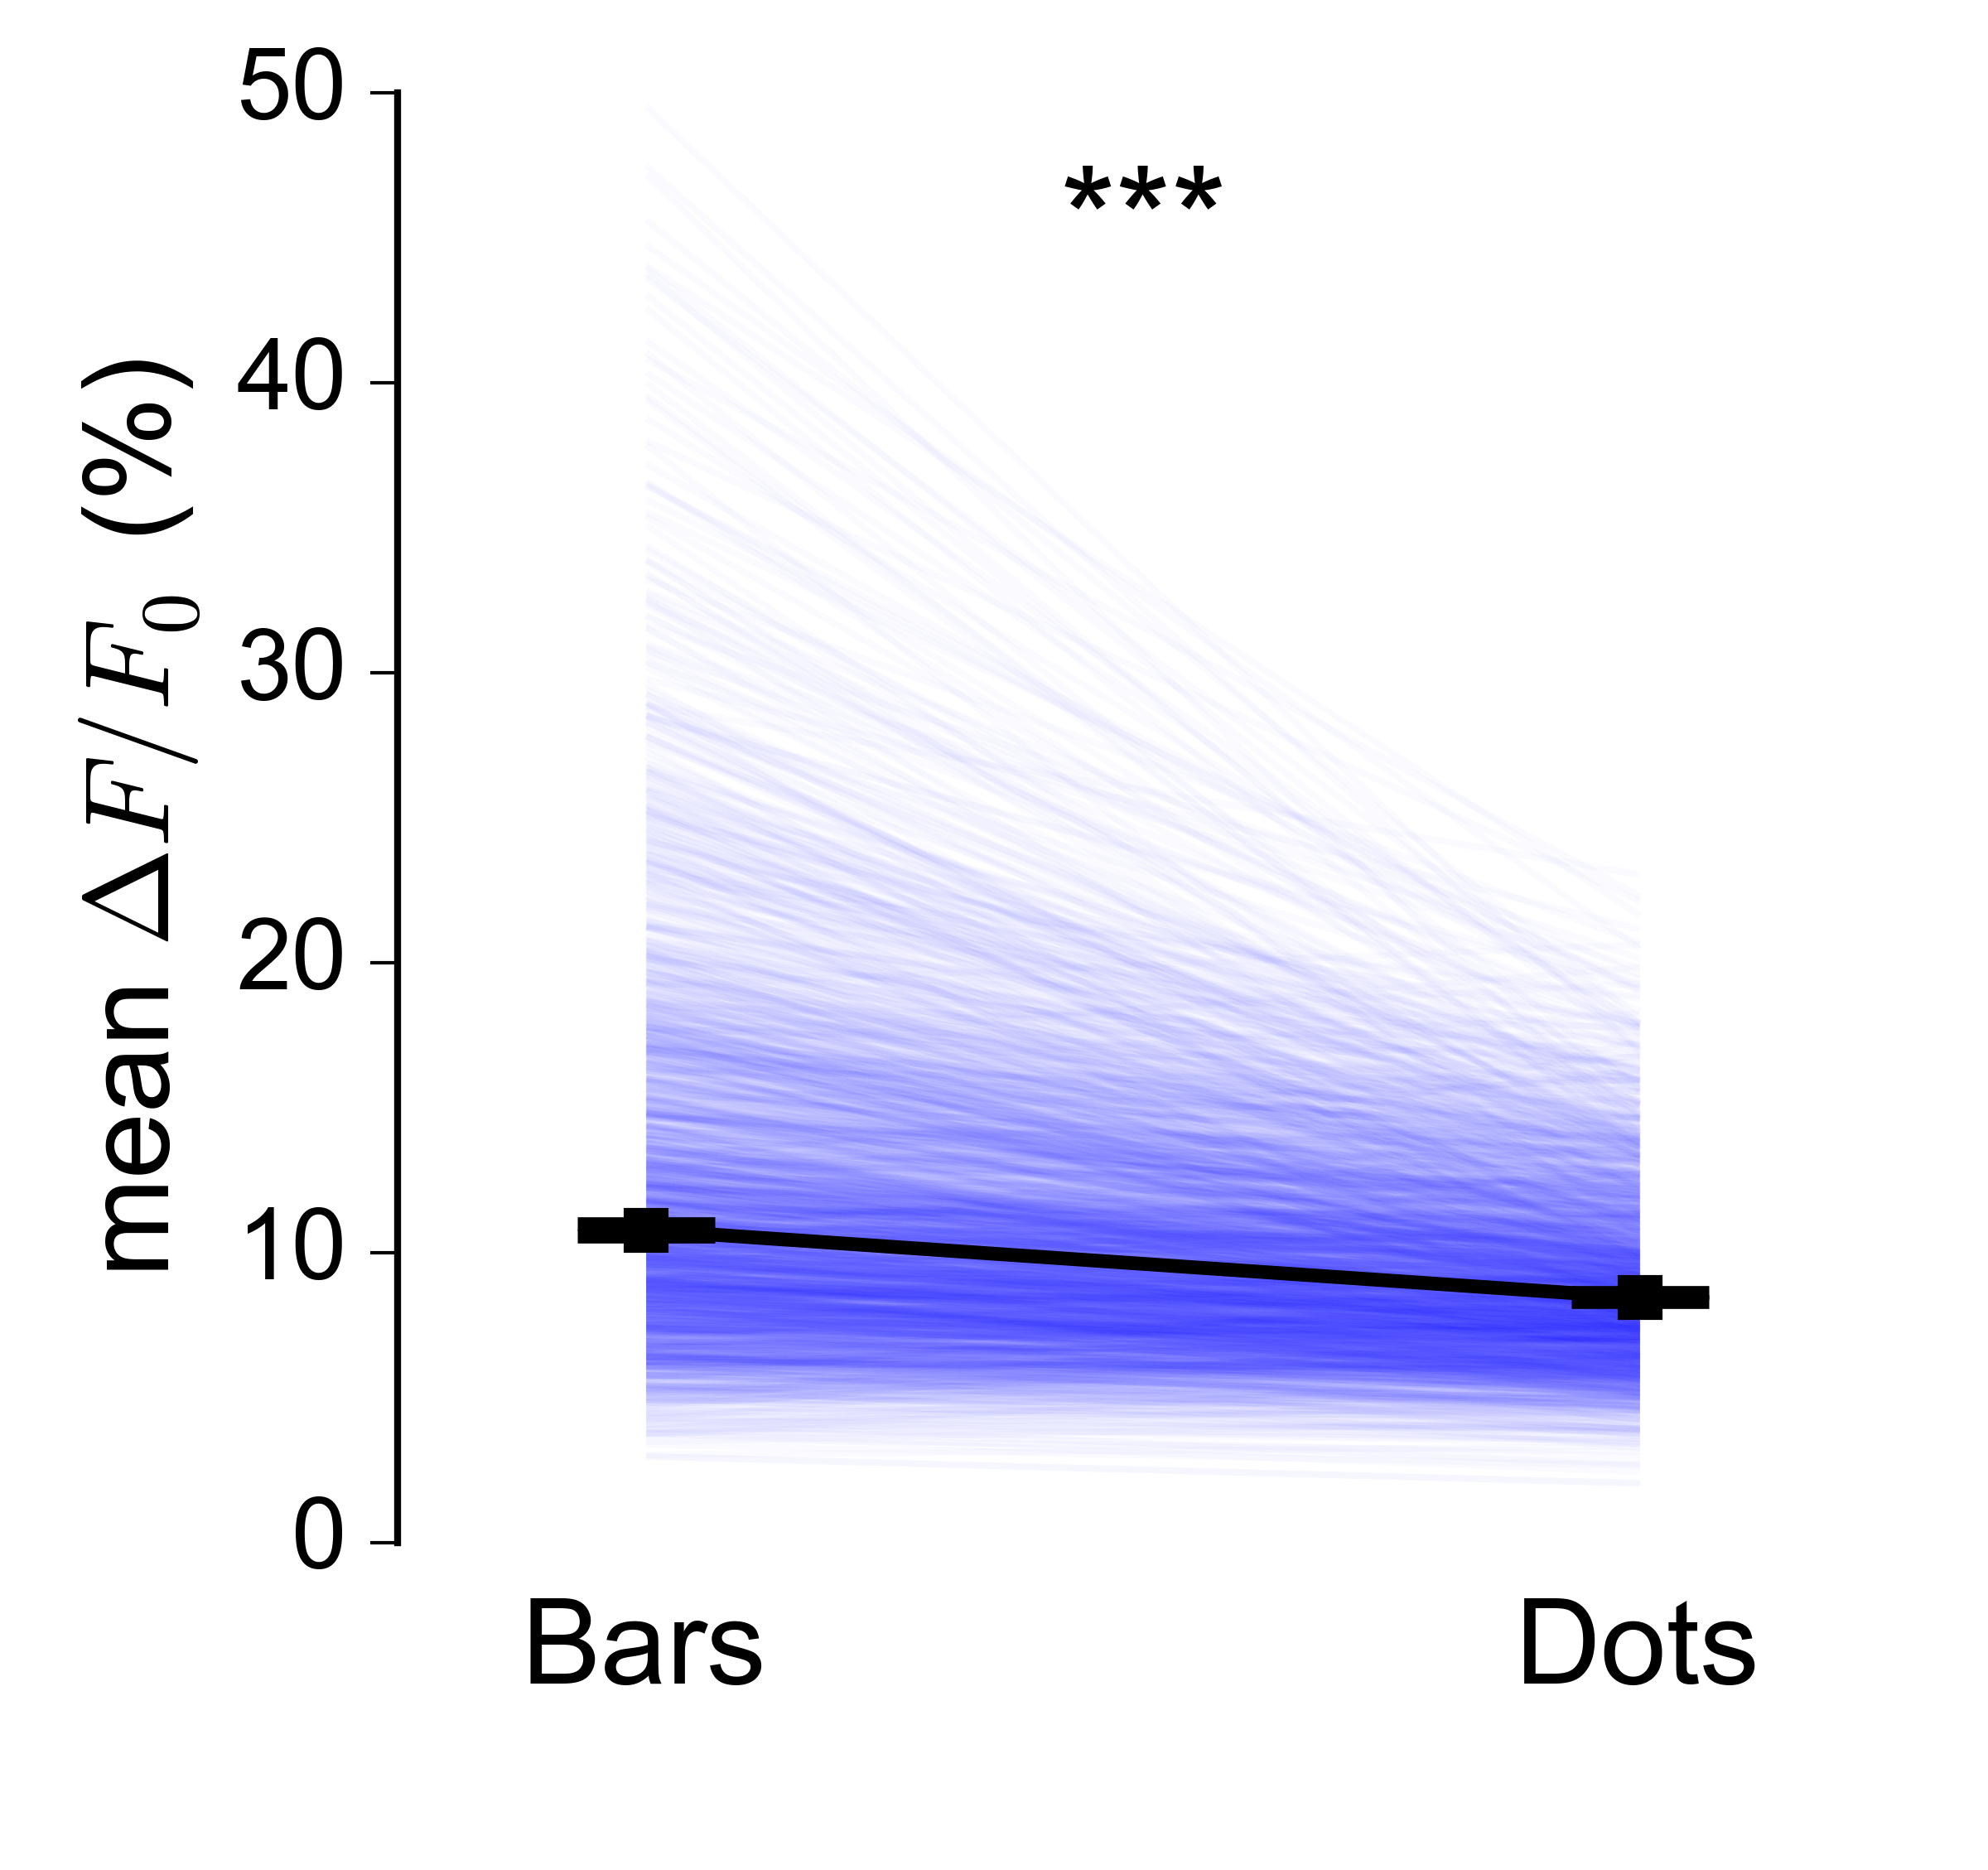
enter image description here

Reducing the alpha helps a bit, but it's still not great. While searching for a solution I came across this paper, and decided to try implementing a 'parallel line plot'. Again, it works very nicely for small numbers of datapoints:
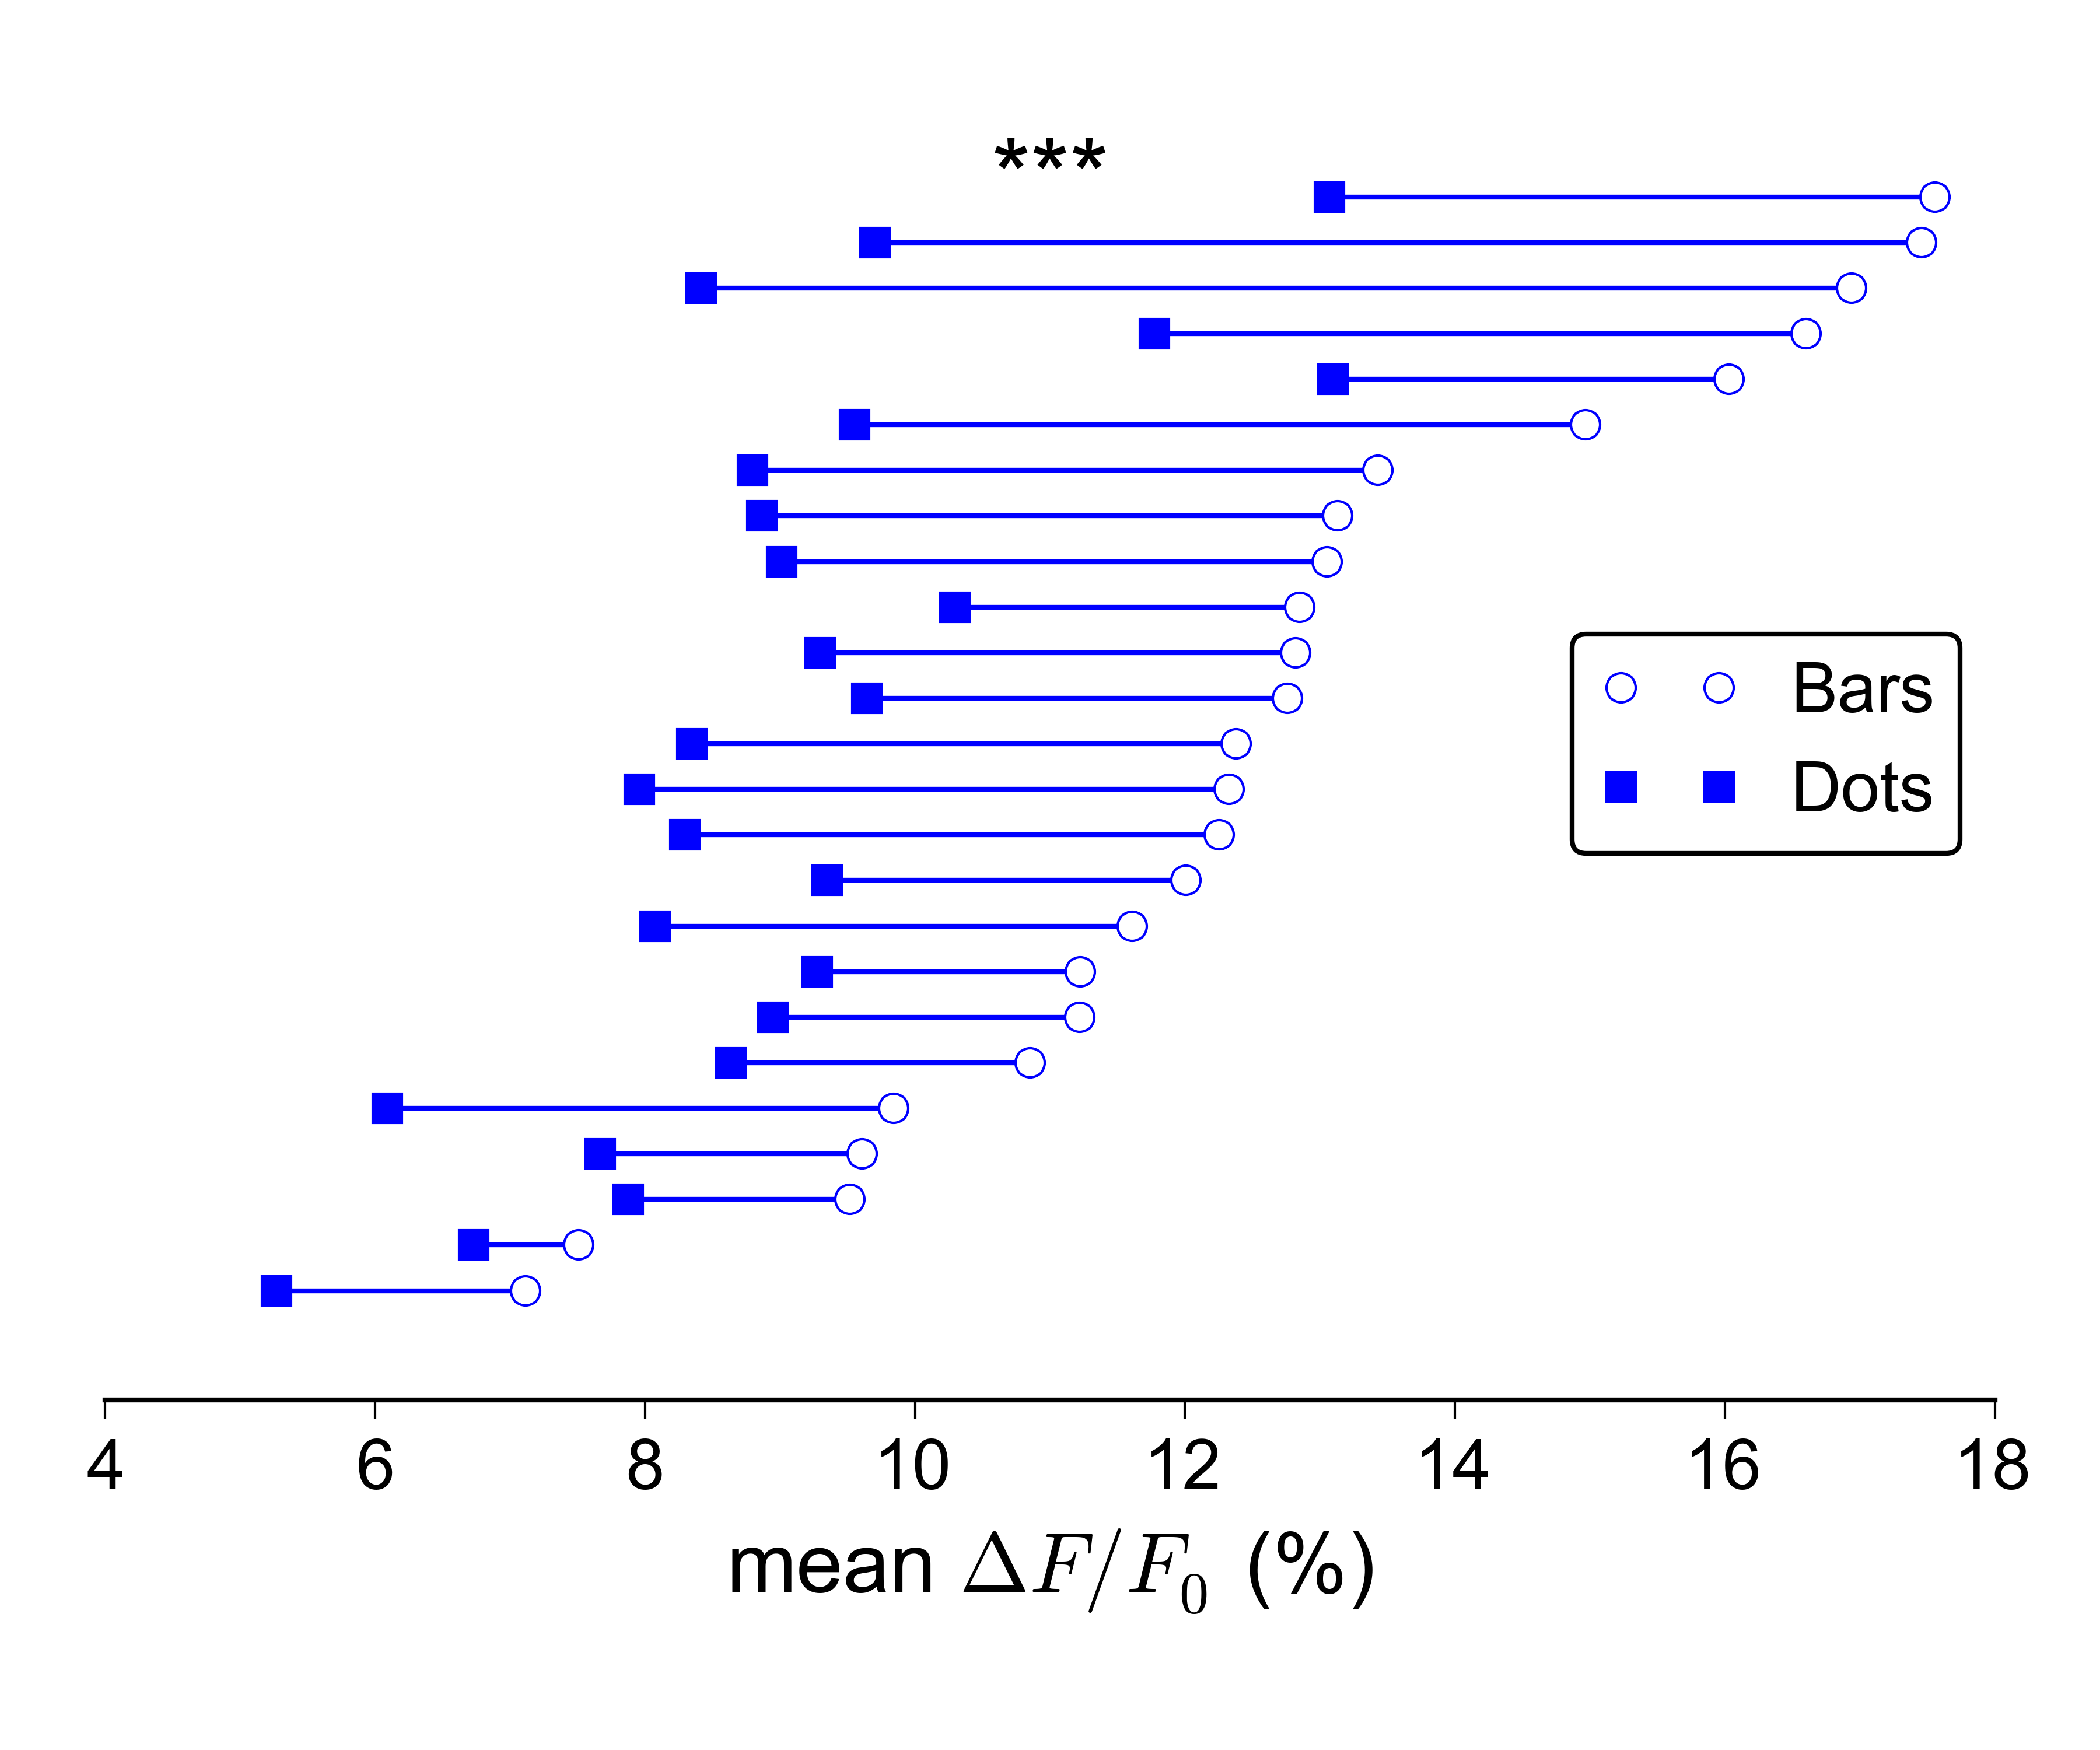
enter image description here

But it's even harder to make this kind of plot look good when the $N$ is very large:
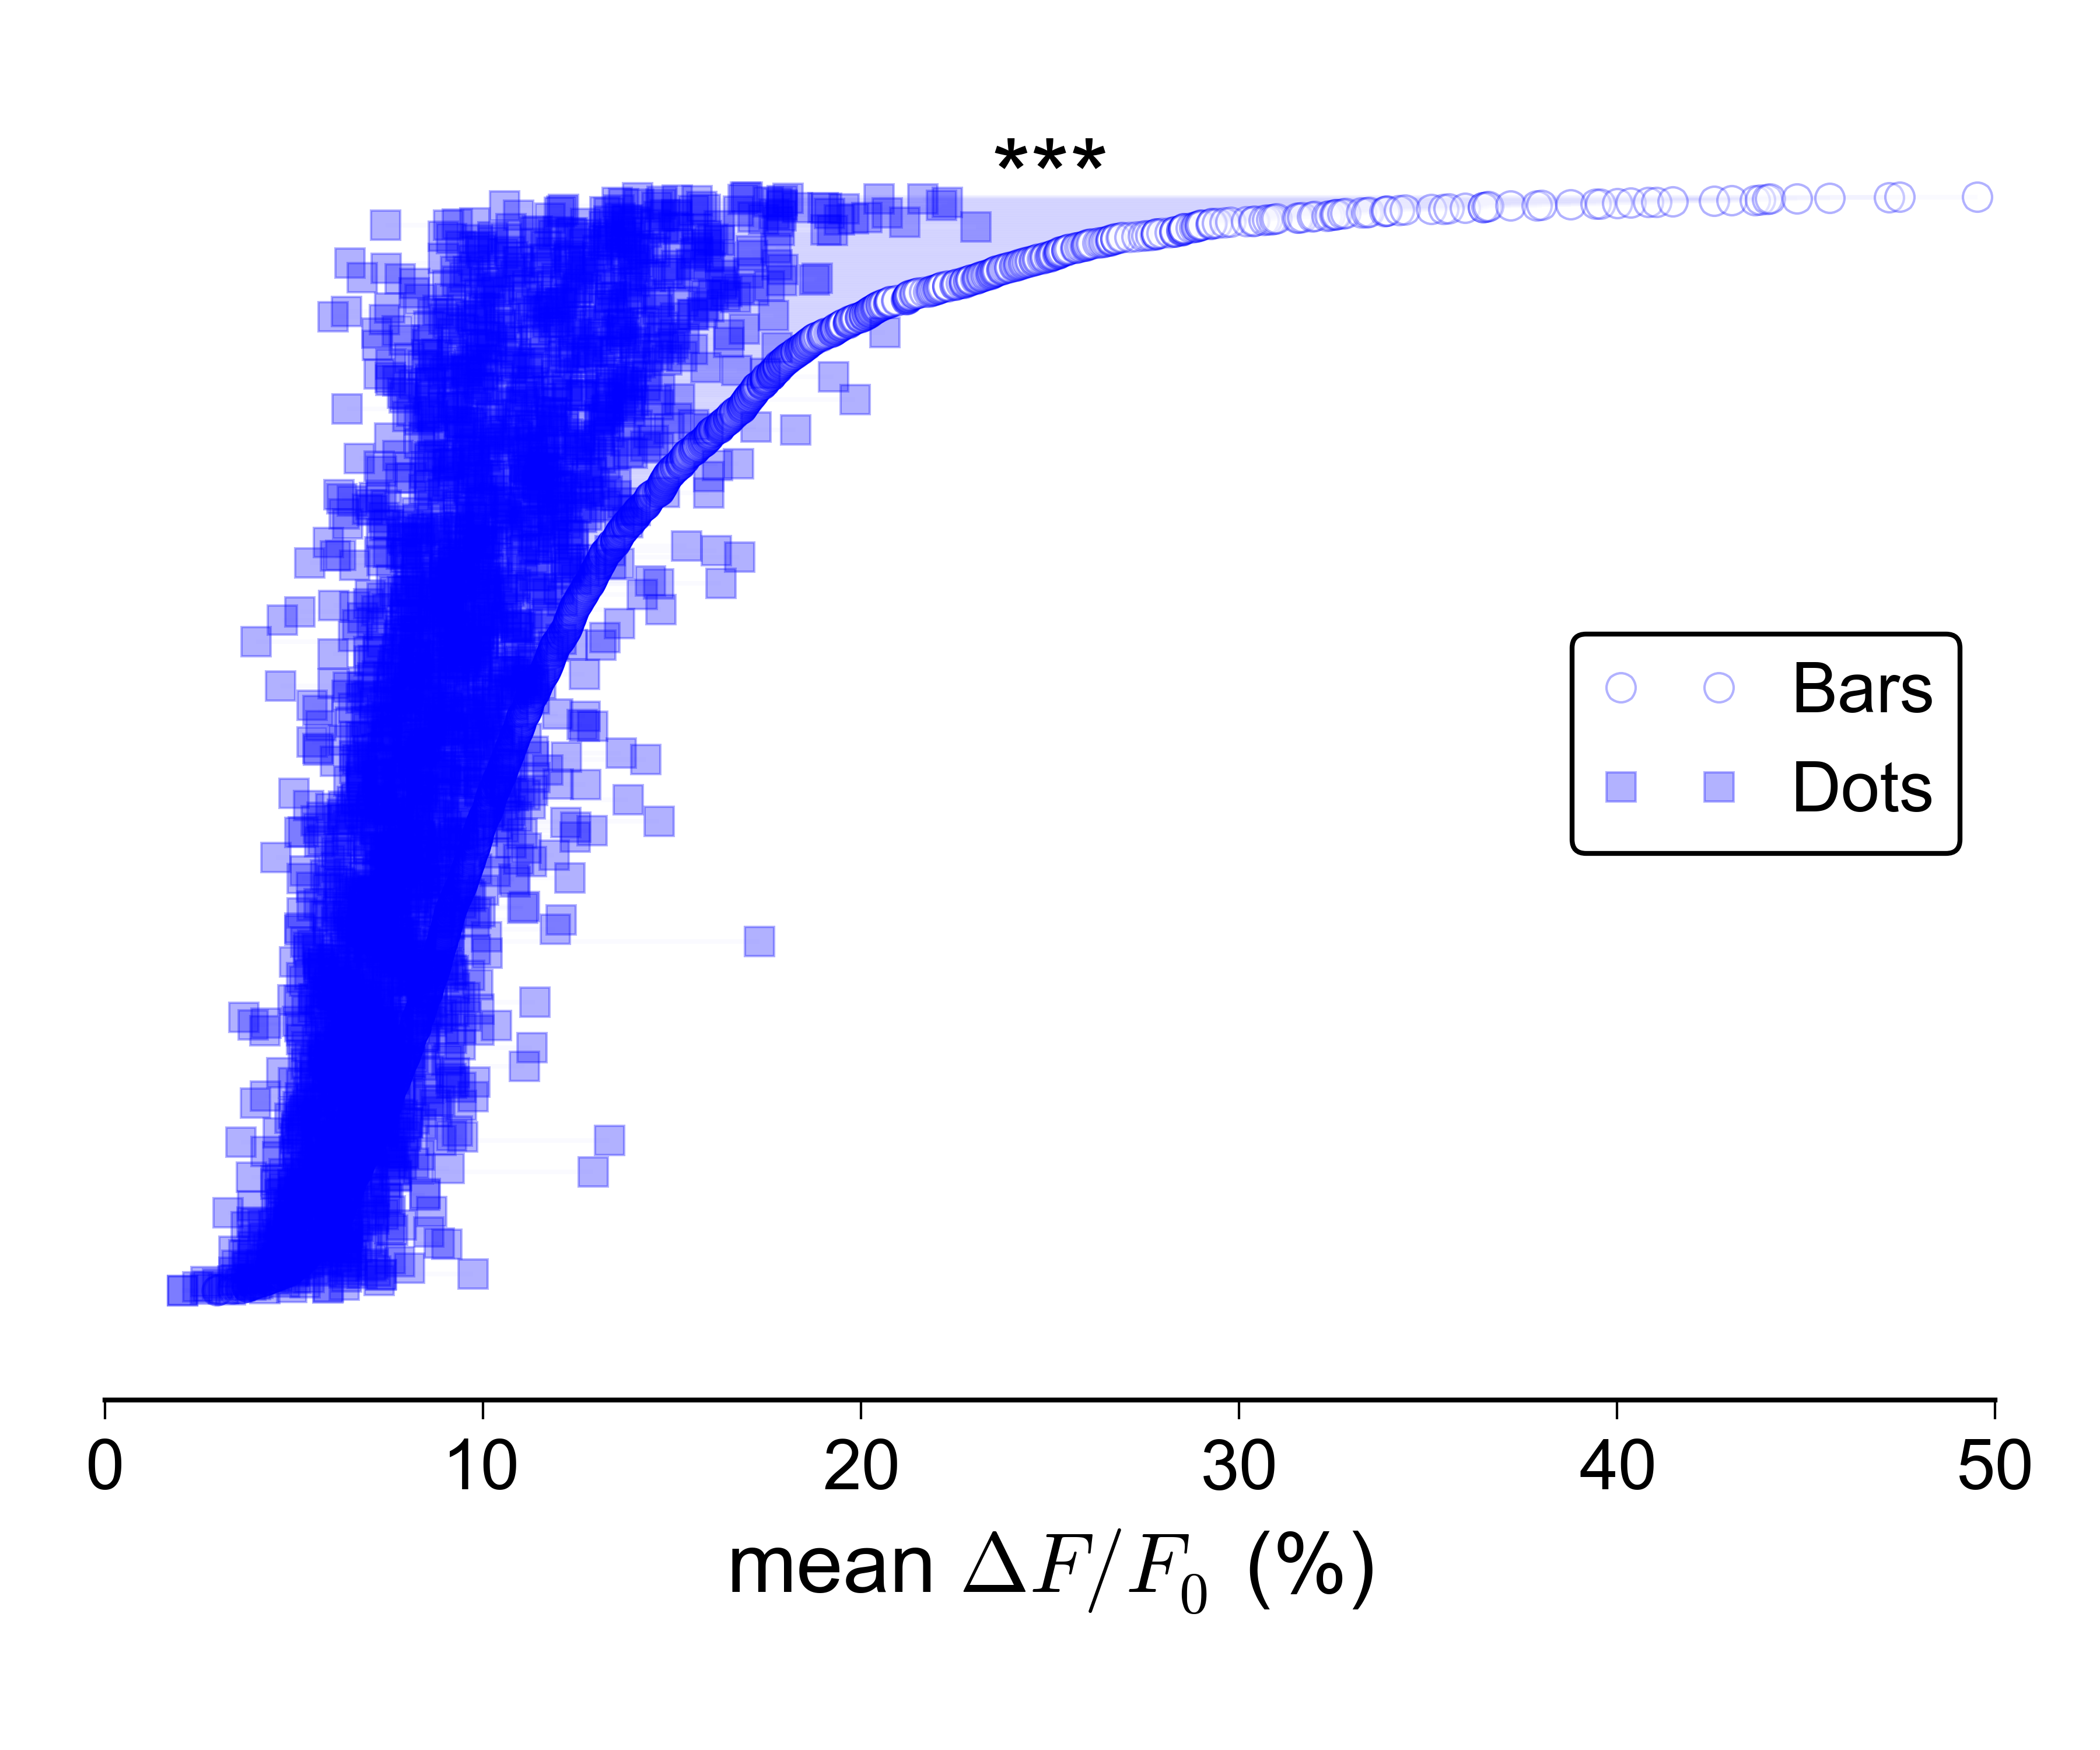
enter image description here

I suppose I could separately show the distributions for the two groups, e.g. with boxplots or violins, and plot a line with errorbars on top showing the two medians/CIs, but I really don't like that idea, since it wouldn't convey the paired nature of the data.

I'm also not overly keen on the idea of a 2D scatter plot: I would prefer a more compact representation, and ideally one in which the values for the two groups are plotted along the same axis. For the sake of completeness, here is what the data looks like as a 2D scatter:
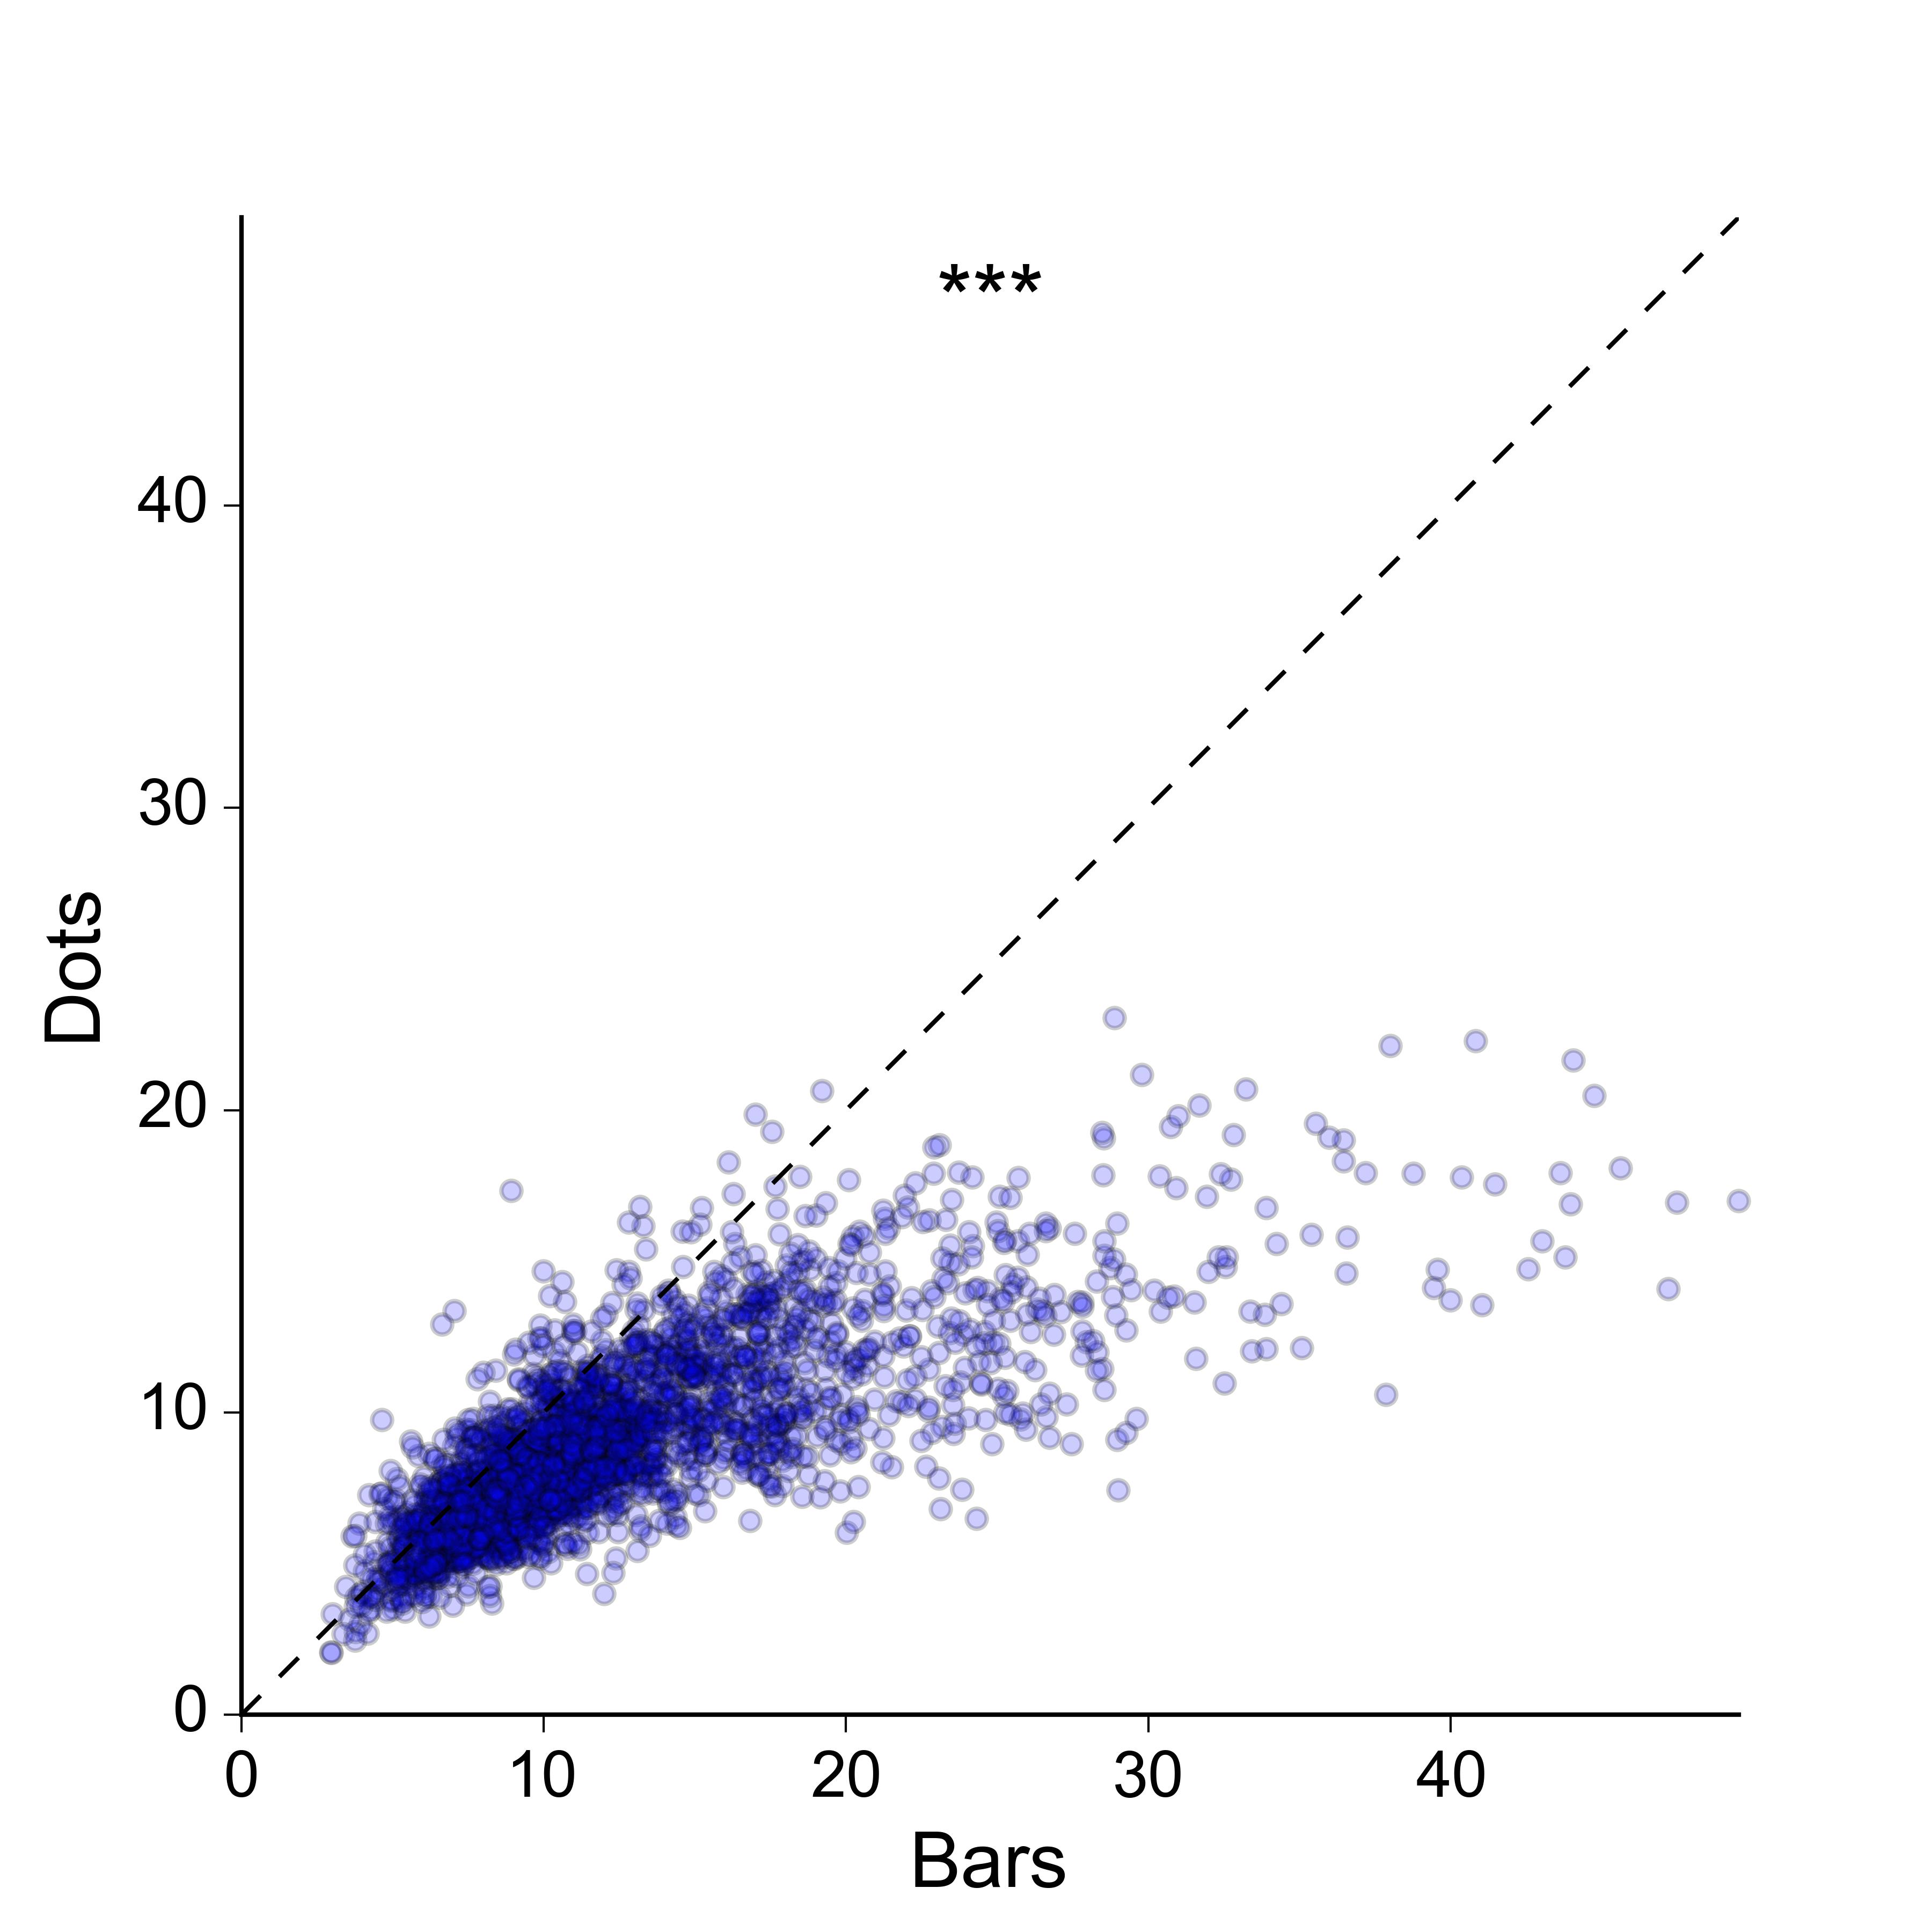
enter image description here

Does anyone know of a better way to represent paired data with a very large sample size? Could you link me to some examples?

Edit

Sorry, I clearly haven't done a good enough job at explaining what I'm looking for. Yes, the 2D scatter plot does work, and there are many ways in which it could be improved in order to convey the density of points better - I could colour-code the dots according to a kernel density estimate, I could make a 2D histogram, I could plot contours on top of the dots etc., etc...

However, I think this is overkill for the message that I'm trying to convey. I don't really care about showing the 2D density of points per se - all I need to do is to show that the values for 'bars' are generally larger than those for 'dots', in as simple and clear a way as possible, and without losing the essential paired nature of the data. Ideally I'd like to plot the paired values for the two groups along the same rather than orthogonal axes, since this makes it easier to visually compare them.

Maybe there is no better option than a scatter plot, but I'd like to know if there are any alternatives that might work.

$\endgroup$
9
  • 1
    $\begingroup$ Have you tried simply plotting the corresponding values of bar on the horizontal and dot on the vertical axis as a scatterplot? $\endgroup$ Commented Jul 22, 2015 at 20:23
  • $\begingroup$ @TillHoffmann Yes, I mentioned that at the end of my question. It's probably the best option I have at the moment, but I would prefer a more compact representation, and ideally one that represents the values of both groups along the same axis (perhaps I'm being unreasonably demanding...). I'll add the scatterplot to my question. $\endgroup$
    – ali_m
    Commented Jul 22, 2015 at 20:41
  • $\begingroup$ sorry, I missed that. How are you generating your synthetic data at the moment? $\endgroup$ Commented Jul 22, 2015 at 20:42
  • 2
    $\begingroup$ Could you explain what you mean by a "compact" representation? The scatterplot is clearly superior to all the others in terms of showing the relationships as well as individually unusual data in a small area; it only grows better as the dataset size increases. (10,000 is not large for a scatterplot.) You mention so many different graphics that it is impossible to deduce what you really need. Please tell us the purpose of your visualization: exactly what kind of information do you hope to learn or convey to others? How accurately and quickly do you intend it to be perceived and understood? $\endgroup$
    – whuber
    Commented Jul 22, 2015 at 20:50
  • 1
    $\begingroup$ @whuber Sorry for being unclear. What I was hoping for was a way to represent the data such that the values for both groups are plotted along the same, rather than orthogonal axes (as they are in the 'sloping line' and 'parallel line' plots). The message is very simple - that the values for the 'bars' are generally higher than those for the 'dots'. Beyond that, I don't care greatly about representing the density of the distribution, although I would like to convey that there are a large number of pairs in the sample. $\endgroup$
    – ali_m
    Commented Jul 22, 2015 at 20:57

5 Answers 5

7
$\begingroup$

Given how I understand your aim, I'd just calculate paired differences (bars - dots), then plot these differences in a histogram or kernel density estimate plot. You could also add any combination of (1) a vertical line corresponding to zero difference (2) any choice of percentiles.

This would highlight what portion of the data have bars exceeding dots, and generally what the observed differences are.

(I've assumed that you're not interested in displaying the actual, raw values of bars and dots in the same plot.)

One could also plot confidence or posterior credible intervals to indicate whether these differences are significant. (H/T @MrMeritology!)

$\endgroup$
2
  • $\begingroup$ Adding to this answer: you could also plot confidence intervals for the paired differences which will visually indicate whether the differences are significant or not. $\endgroup$ Commented Jul 23, 2015 at 5:44
  • $\begingroup$ With so many pairs, it could be interesting to see if the difference depends on ths "starting point" as well, so you could fit a model like $y_B=\mu+\text{offset}(y_A)+ \Delta(y_A-\bar{y}_A$ or maybe even a quadratic term! Graphically, plot the paisr as you have shown, but with reduced alpha and color depending on slope. $\endgroup$ Commented Apr 25, 2016 at 11:11
3
$\begingroup$

With so many pairs you have the possibility of investigating more profoundly the structure, like if the difference $y_B - y_A$ depends on the "starting point" $y_A$!

You could fit a model like $$ y_B=\mu+\text{offset}(y_A) +\Delta (y_A-\bar{y}_A) + \epsilon $$ and you could even add a quadratic term $+\Delta_2 (y_A-\bar{y}_A)^2$ or you could replace the linear+quadratic term with a spline using a generalized additive model (or regression splines).

Graphically you could show the lines as you have shown, with a reduced alpha factor (*), maybe reducing further by only showing a random sample of lines. Then you could color the lines according to slope ...

For Bland-Altman plots, mentioned in a comment by Nick Cox, see for instance for an example Agreement between methods with multiple observations per individual or look through the tag .

(*) alpha factor here is a graphical parameter making points in the plot transparent, so the first plotted points is not totally occulted by later overplotting.

$\endgroup$
1
  • 1
    $\begingroup$ In similar spirit, I think, plotting difference (A $-$ B) versus mean (A + B)/2 is a common device in many fields. A name that has stuck in medical statistics is "Bland-Altman plots" although the authors concerned made no claim to originality and the idea goes back at least to the 1950s. $\endgroup$
    – Nick Cox
    Commented Oct 12, 2018 at 10:41
1
$\begingroup$

I would prefer the 2D scatter plot. I would draw the reference line in light gray for more contrast in the crowded region. To alleviate crowding, draw the markers without border, further reduce alpha, reduce marker size.

That said, if you are more interested in the typical pairs than in the wings of the distribution, try line-plotting the cumulative sum of the dots versus the cumulative sum of the bars. The plot is still 2D but with much less ink. To save also plotting area, you may rotate the trace by 45° so that the frame serves as the reference direction.

That plot would also show any trend in the data. If the process is known to be stationary, sort the pairs by, eg, their geometric mean, sqrt(bars*dots).

$\endgroup$
0
$\begingroup$

I would recommend plotting the lines as you have them for the median and the quartiles, or as many percentiles as you would like for that matter. The median could remain thicker/more discernible than than other percentile lines. This would help preserve the ability to see how the data behave across the distribution without compromising the simplicity and familiarity of the plot that is currently used in your field.

Also, with such a high sample size, the mean or median trend with error bars would likely be sufficient since you would so thoroughly be enjoying the central limit theorem. The biomedical field also relies on those paired line plots, but this is often the case because the sample size could be on the order of 10-20, so it is important to visualise potential leverage points.

$\endgroup$
0
$\begingroup$

My first suggestion is a scatter plot.

If 10000 dots unevenly spread in your plot is still a vague cloud, consider a heat map. The colour of the pixel at x = 10.5, y = 11.5 would indicate how many times value between 10.45 and 10.55 is mapped onto a value between 11.45 and 11.55 : 0 = white = RGB(255,255,255), 1 = blue = RGB(0,0,255), 2 = RGB(1,0,254), ... 256 and above = RGB(255,0,0) = red

$\endgroup$
6
  • $\begingroup$ That essentially gives me the same sort of representation as a 2D scatter, except with less resolution. I may end up doing something like this, but I was ideally hoping for a more compact representation that plots the values for both groups along the same axis, rather than orthogonal axes. $\endgroup$
    – ali_m
    Commented Jul 22, 2015 at 20:50
  • 1
    $\begingroup$ Looking at your scatter plot, I see you are loosing a lot of information in the centre of your "ink spot". You need to do something, either by applying a transformation (logarithm?) or with the heath map I suggest. $\endgroup$ Commented Jul 22, 2015 at 20:59
  • $\begingroup$ Sorry! Your suggestion is a totally reasonable one - I just haven't done a good enough job at explaining what I'm looking for. Yes, a two-dimensional plot (scatter, heatmap, contour plot etc.) would do a good job at representing the density of sample points, but I think that's more information than I really need to display. All I need to do is show that the values for 'bars' are generally higher than those for 'dots'. I'm looking for the simplest possible way to show this whilst preserving the paired nature of the data. $\endgroup$
    – ali_m
    Commented Jul 22, 2015 at 21:35
  • $\begingroup$ Does the diagonal on the catter plot not indicate the direction well enough? $\endgroup$ Commented Jul 22, 2015 at 21:38
  • $\begingroup$ No, but perhaps I have unreasonable expectations :-) $\endgroup$
    – ali_m
    Commented Jul 22, 2015 at 21:39

Your Answer

By clicking “Post Your Answer”, you agree to our terms of service and acknowledge you have read our privacy policy.

Not the answer you're looking for? Browse other questions tagged or ask your own question.