27
$\begingroup$

In other words, based on the following, what is p?

In order to make this a math problem rather than anthropology or social science, and to simplify the problem, assume that mates are selected with equal probability across the population, except that siblings and first cousins never mate, and mates are always selected from the same generation.

  • $n_1$ -- initial population
  • $g$ -- the number generations.
  • $c$ -- the average number of children per couple. (If necessary for the answer, assume that every couple has exactly the same number of children.)
  • $z$ -- the percentage of people who have no children, and who are not considered part of a couple.
  • $n_2$ -- population at the final generation. (Either $n_2$ or $z$ should be given, and (I think) the other can be calculated.)
  • $p$ -- probability of someone in the final generation being a descendant of a particular person in the initial generation.

These variables can be changed, omitted, or added to, of course. I am assuming for simplicity that $c$ and $z$ do not change over time. I realize this will get a very rough estimate, but it's a starting point.

Part 2 (suggestion for further research):

How can you consider that mates are not selected with globally uniform probability? In reality, mates are more likely to be of the same geographical area, socio-economic background, race, and religious background. Without researching the actual probabilities for this, how would variables for these factors come into play? How important would this be?

$\endgroup$
4
  • 2
    $\begingroup$ @John: Thanks for your edit. I believe the prevailing consensus (on this site and others) is that we not edit questions simply to add the homework tag. It is better for all involved to let the OP do that. You might be interested in this meta thread if you haven't already seen it. $\endgroup$
    – cardinal
    Commented Oct 22, 2011 at 13:10
  • $\begingroup$ I am just curious. I am not a student and this is not anybody's homework. I was just joking about the extra credit, although I can see how it would imply homework. $\endgroup$
    – xpda
    Commented Oct 22, 2011 at 14:56
  • 4
    $\begingroup$ To get an initial sense of the answers, consider the fraction $f$ of the population that is not related to a given ancestor by descent. Initially $f = (n-1)/n$ for a population of $n$. With random mixing, $f$ is squared after each generation. In a starting population of $n=10^8$, say, this implies $f$ is almost surely $0$ after $32$ generations (about $600$ - $800$ years). $\endgroup$
    – whuber
    Commented Oct 24, 2011 at 15:25
  • 1
    $\begingroup$ I believe there is some academic research on the probability of a unique surname going extinct. Although not identical to the problem posed, that might provide some interesting insight (but unfortunately I can't remember where it's from). Oddly enough, I believe those studies led to some insight in the math behind the spread of infectious disease... $\endgroup$ Commented Oct 24, 2011 at 16:19

6 Answers 6

14
+50
$\begingroup$

Because this question is receiving answers that vary from astronomically small to almost 100%, I would like to offer a simulation to serve as a reference and inspiration for improved solutions.

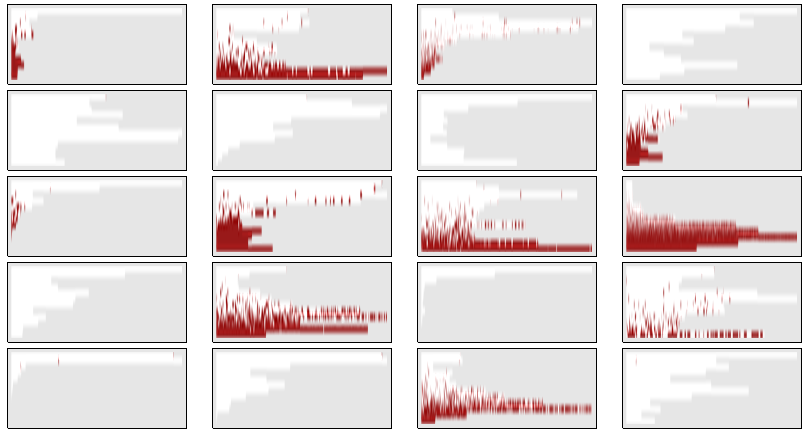
I call these "flame plots." Each one documents the dispersion of genetic material within a population as it reproduces in discrete generations. The plots are arrays of thin vertical segments depicting people. Each row represents a generation, with the starting one at the top. The descendants of each generation are in the row immediately beneath it.

At the beginning, just one person in a population of size $n$ is marked and plots as red. (It's hard to see, but they are always plotted at the right of the top row.) Their direct descendants are likewise drawn in red; they will show up in completely random positions. Other descendants are plotted as white. Because the population sizes can vary from one generation to the next, a gray border at the right is used to fill empty space.

Here is an array of 20 independent simulation results.
Flame plots

The red genetic material eventually died out in nine of these simulations, leaving survivors in the remaining 11 (55%). (In one scenario, the bottom left, it looks like the entire population eventually died out.) Wherever there were survivors, though, almost all the population contained the red genetic material. This provides evidence that the chance of a randomly selected individual from the last generation containing the red gene is about 50%.

The simulation works by randomly determining a survivorship and a mean birth rate at the beginning of each generation. Survivorship is drawn from a Beta(6,2) distribution: it averages 75%. This number reflects both mortality before adulthood and those people not having any children. Birth rate is drawn from a Gamma(2.8, 1) distribution, so it averages 2.8. The result is a brutal story of insufficient reproductive capacity to compensate for generally high mortality. It represents an extremely pessimistic, worst-case model--but (as I have suggested in comments) the ability of the population to grow is not essential. All that matters in each generation is the proportion of red within the population.

To model reproduction, the current population is thinned down to the survivors by taking a simple random sample of the desired size. These survivors are randomly paired (any odd survivor left over after pairing doesn't get to reproduce). Each pair produces a number of children drawn from a Poisson distribution whose mean is the generation's birth rate. If either of the parents contains the red marker, all the children inherit it: this models the idea of direct descent through either parent.

This example starts with a population of 512 and runs the simulation for 11 generations (12 rows including the start). Variations of this simulation starting with as few as $n=8$ and as many as $2^{14} = 16,384$ people, using different amounts of survivorship and birth rates, all exhibit similar characteristics: by the end of $\log_2(n)$ generations (nine in this case), there's about a 1/3 chance that all the red has died out, but if it hasn't, then the majority of the population is red. Within two or three more generations, almost all the population is red and will remain red (or else the population will die out altogether).

A survivorship of 75% or less in a generation isn't fanciful, by the way. In late 1347 rats infested with bubonic plague first made their way from Asia to Europe; during the next three years, somewhere between 10% and 50% of the European population died as a result. The plague recurred almost once a generation for hundreds of years afterwards (but usually not with the same extreme mortality).


Code

The simulation was created with Mathematica 8:

randomPairs[s_List] := Partition[s[[Ordering[RandomReal[{0, 1}, Length[s]]]]], 2];

next[s_List, survive_, nKids_] := Flatten[ConstantArray[Max[#], 
   RandomVariate[PoissonDistribution[nKids]]] & /@ 
   randomPairs[RandomSample[s, Ceiling[survive Length[s]]]]] 

Partition[Table[
   With[{n = 6}, ArrayPlot[NestList[next[#, RandomVariate[BetaDistribution[6, 2]], 
        RandomVariate[GammaDistribution[3.2, 1]]] &, 
        Join[ConstantArray[0, 2^n - 1], ConstantArray[1, 1]], n + 2], 
     AspectRatio -> 2^(n/3)/(2 n), 
     ColorRules -> {1 -> RGBColor[.6, .1, .1]},  
     Background -> RGBColor[.9, .9, .9]]
    ], {i, 1, 20}
   ], 4] // TableForm
$\endgroup$
4
  • 1
    $\begingroup$ I think modeling like this may be the best approach. It is far simpler and more fun (for me) than the math, and it should make it much easier to introduce factors restricting mate selection. Do you have any recommendations, caveats, or other advice before I dive in on this? $\endgroup$
    – xpda
    Commented Oct 26, 2011 at 2:43
  • 4
    $\begingroup$ @xpda Mathematical solutions will provide insight into what matters and what doesn't. For instance, they will show that you don't necessarily need to model huge populations. They will also indicate the role played by variability, which is harder to handle analytically and comes to the fore in a simulation. $\endgroup$
    – whuber
    Commented Oct 26, 2011 at 3:22
  • 1
    $\begingroup$ @whuber Did you run the simulation in Mathematica? Would you mind posting code? $\endgroup$ Commented Nov 26, 2012 at 21:48
  • 1
    $\begingroup$ @Max The code is now up. I apologize for the lack of comments. If you run each of randomPairs and next on test data, their functions should become apparent. Notice the use of NestList to iterate next in order to produce multiple generations. $\endgroup$
    – whuber
    Commented Nov 26, 2012 at 22:28
3
$\begingroup$

What happens when you try counting ancestors?

You have 2 parents, 4 grandparents, 8 great grandparents, ... So if you go back $n$ generations then you have $2^n$ ancestors. Let's assume an average generation length of $25$ years. Then there have been about $28$ generations since 1300, which gives us about 268 million ancestors at that time.

This is the right ballpark, but there is something wrong with this calculation, because the population of Earth in 1300 did not mix uniformly, and we are ignoring intermarriage within your ancestral "tree", i.e. we are double counting some ancestors.

Still, I think, this can lead to a correct upper bound on the probability that randomly chosen person in 1300 is your ancestor by taking the ratio $2^{28}$ to the population in 1300

$\endgroup$
4
  • 2
    $\begingroup$ Very significant considering a lot of the population back then were rather isolated from each other, so there was far less opportunity to avoid intermarriages. $\endgroup$
    – dcl
    Commented Oct 24, 2011 at 11:18
  • 2
    $\begingroup$ So let's assume that the OP to be from English descent and around 1300, England's population was over one million. (Let's say before the great famine). How would that change your analysis? $\endgroup$
    – dassouki
    Commented Oct 24, 2011 at 12:31
  • $\begingroup$ $2^{28}\approx 268$ million, not billion. It's the right ballpark. $\endgroup$
    – whuber
    Commented Oct 25, 2011 at 22:16
  • $\begingroup$ D'oh! Edited the answer. The calculation still ignores intermarriage, but this might give a correct upper bound on the probability that a randomly chosen person in 1300 is your ancestor by taking the fraction: $2^{28} / 3$ or $4$ hundred million. $\endgroup$
    – vqv
    Commented Oct 25, 2011 at 22:24
2
$\begingroup$

The further back you go, the more likely that you are related to a person that successfully passed along their genes that lived in that time. Of the 1/4 billion ancestors that you have that lived in 1300, many of them would show up hundreds (if not thousands, millions) of times in your family tree. Genetic drift and the number of times we are directly related to someone are likely more relevant to the differences in our genetic code than who our ancestors were.

$\endgroup$
0
$\begingroup$

The probability is=1-z, every descendant in this problem is related to ancestors above. Whatever the initial rate of reproduction is (1-z) is your probability of being descendant from someone in the initial population.Only uncertain probability is what are the chances of being alive in final population.

I agree with Erad's answer, although I now think it responds to a question that was not asked - namely what is the probability that you are alive given certain known reproductive and population constraints on your fore-bearers.

$\endgroup$
6
  • $\begingroup$ The question is to find the probability of someone in the final generation being descended from a particular person in the initial generation. If $n_1$=360 million and $z$=.2, then the probability wouldn't be 1-$z$ at, for example, $g$=1. $\endgroup$
    – xpda
    Commented Oct 25, 2011 at 22:03
  • $\begingroup$ Also, to clarify, the question is to find the probability of a particular person in the final generation being descended from a particular person in the initial generation. $\endgroup$
    – xpda
    Commented Oct 25, 2011 at 22:11
  • 1
    $\begingroup$ @xpda That's a strange interpretation, because everybody either is, or is not, descended from any particular individual, as can be established through DNA testing. I think the way many people may have been understanding your question is if we pick an arbitrary person "$A$" in the year 1300 and we select a random person alive today, what is the chance they are descended from $A$? This is answered by estimating the proportion of today's population that is descended from $A$. We could also take $A$ to be randomly selected. $\endgroup$
    – whuber
    Commented Oct 25, 2011 at 22:19
  • $\begingroup$ @Wipa Descartes' cogito, ergo sum strongly suggests the probability I'm alive given any constraints on my forebears is 100% :-) $\endgroup$
    – whuber
    Commented Oct 25, 2011 at 22:21
  • $\begingroup$ @whuber, you are correct. I believe we are talking about the same problem. The thing I wanted to clarify is that I am not looking for the likelihood of someone in the first generation having a descendant alive in the last generation. I was afraid that's where Wipa came up with (1-z) for the answer. $\endgroup$
    – xpda
    Commented Oct 26, 2011 at 2:23
0
$\begingroup$

My updated short answer is: $$ p > {(1-z)} \times {{{1} \over {n_1(1-z)}} \over {2}} = {2 \over n_1} $$

Answer explained:
Given a particular person today, it is certain that they are a descendant of at least 2 people in 1300.

When picking a particular person in 1300, there is (1-z) chance that person never reproduced, and the other term is for the number of 'parent couples', and the probability for the person to be related to this couple (1 / number of couples).

The (1-z) ends up cancelling out, leaving us with $$ p > {2 \over n_1} $$

Now just for fun but not necessary for solving the probability question
Here is the population of any given generation k in the chain between then and today. $$ n_{k+1} = {{n_k(1-z)\times c} \over 2} = {n_1(1-z)^kc^k \over 2^k}$$

Lets plug in some numbers as an example. For assumptions, I use:
g = 28 (25-year generations between 1300 and 2011)
n = 360M (world population estimate in 1300 from wikipedia)
z = 0.2, c = 2.77=8 (not real data, but does end up with about 7B people in 2011)

Resulting in:
$$p > 2 / 360,000,000 = 5.56 \times 10^{-9}$$ or over one in 180M.

Thanks for reading, Erad

$\endgroup$
9
  • $\begingroup$ What is $c$? And what is $z$? $\endgroup$
    – mpiktas
    Commented Oct 25, 2011 at 9:26
  • $\begingroup$ Based on the original question above: c = the average number of children per couple, and z = the percentage of people who have no children $\endgroup$
    – Erad
    Commented Oct 25, 2011 at 10:54
  • 2
    $\begingroup$ Hm, how come your probability is less than $1/n$=$1/360M\approx 10^{-9}$? $\endgroup$
    – mpiktas
    Commented Oct 25, 2011 at 11:03
  • 3
    $\begingroup$ The answer given here holds for each member of the original population, no matter who they were. Summing over all members gives an upper bound for the probability that we are descended today from some person in the year 1300 of $360,000,000 / (2.66 \times 10^{249}) \ll 1$, which is obviously way wrong (unless alien clones were introduced along the way...). $\endgroup$
    – whuber
    Commented Oct 25, 2011 at 20:10
  • 1
    $\begingroup$ @Erad In your comment you appear to assume that all of today's population is descended from a tiny fraction of the world in 1300. That's just not plausible. However, suppose for the sake of argument--and to examine an extreme case--that everyone today is known to have descended solely from one couple, "Adam" and "Eve", alive in 1300. Then the chance of descent is either 100% if Adam or Eve are the "particular person" of the question or else is 0%. This chance, averaged over the population in 1300, is still about $10^{-8}$, far higher than you compute. $\endgroup$
    – whuber
    Commented Oct 25, 2011 at 22:28
0
$\begingroup$

This is a very interesting question as it is asking us to mathematically solve a fractal. Such as the famous game of life.

The % of the population which each generation related to will grow over each iteration, starting at $p_1={2 \over n_1}$ and at the limit generation will approach $\lim_{k \to \infty } p_k = (1-z)$.

If we denote $p_k$ as the probability of someone in generation $k$ to be related to the initial population. And for simplicity lets relax the siblings & cousins rule (can be added later). Then: $$p_1 = {2 \over n_1}$$

As each person in the new generation has exactly 2 ancestors in the initial population. $$ p_2 = relatives \times {2 \over n_2} + non.relatives \times {4 \over n_2} $$ In this case relatives could be calculated as: $$ relatives = {\binom{c}{2} \times {n \over c} \over \binom{n}{2}} = {c-1 \over n-1}$$ Or in other words, the number of sibling combinations, times the number of siblings family, divided by the total mating combinations. $$p_3 = immediate.relatives \times {4 \over n_3} + cousins \times {6 \over n_3} + non.relatives \times {8 \over n_3}$$

With each generation, the probability to be related to someone at the initial population will undoubtedly grow, but at a decreasing pace. This is because the probability to draw "relatives" which are coming from the same or similar tree will grow.

Lets use ethnicity as an example. Lets say we know for a fact someone is 100% Caucasian. At generation 28 he is most likely related to a significant portion of the Caucasian population in 1300 (As shown by @whuber simulation). Lets say he is marrying someone who is 100% of a different ethnicity. Their offspring will be linked to approximately double the number of people they are linked to from 1300.

Another interesting thought is that given the human (homosapien) race started from ~600 people in Africa, then we are most likely a genetic permutation of all of them who successfully mated.

$\endgroup$

Your Answer

By clicking “Post Your Answer”, you agree to our terms of service and acknowledge you have read our privacy policy.

Not the answer you're looking for? Browse other questions tagged or ask your own question.