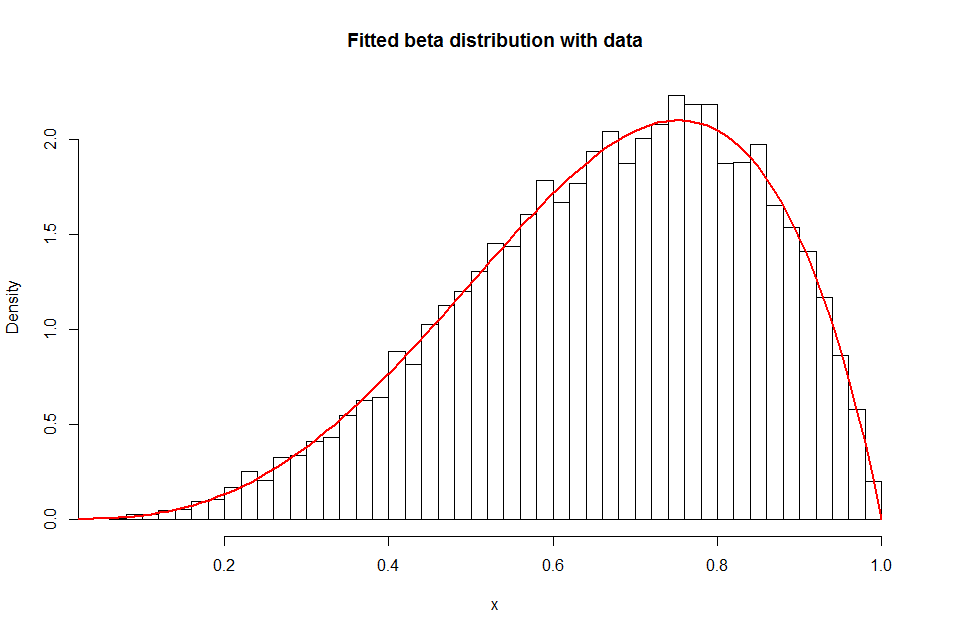
I want to plot a probability distribution. I know the mean and think that a normal distribution would be a poor description of my beliefs. I either assume that the values smaller (or larger) than my mean are more likely to occur than the ones larger (or smaller). I don't know anything else, except, that the values are somehow in the vicinity of my mean...
For example, my mean is 0.151 and I believe that larger values are more likely to occur than smaller ones. What distribution should I choose and how can I implement this in R?
EDIT
The mean represents a share and therefore is limited to [0,1]. The change I want to predict will be relatively small and start from the mean, resulting to be larger than the mean (or smaller).
It might help to specify, what I don't want:
- A uniform distribution would give specified values the same probability. For example, if I believe values between 0.1 and 0.2 are likely, each value is more or less equal to "happen".
- With a normal distribution the values smaller and larger than my mean would be equal likely with some sd.
EDIT 2
The undertaking: To predict, for example, the share of a given party in election 2, I start with the mean in election 1 (0.151). Additionally, I assume that the values in election 2 are more likely to be larger than 0.151, but of course, I can't be sure.

